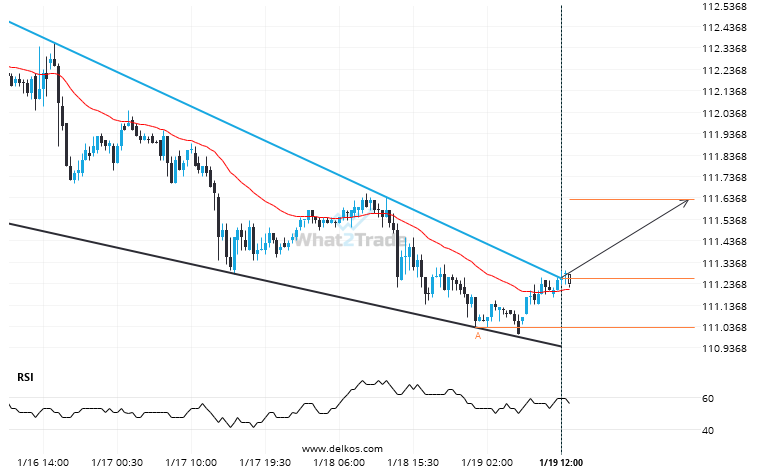
10 Yr Us Treasury Note March 2024 moved through the resistance line of a Falling Wedge at 111.26011029411764 on the 30 Minutes chart. This line has been tested a number of times in the past and this breakout could mean an upcoming change from the current trend. It may continue in its current direction toward 111.6284.
10 Yr Us Treasury Note March 2024 has broken through resistance of a Falling Wedge. It has touched this line at least twice in the last 8 days.