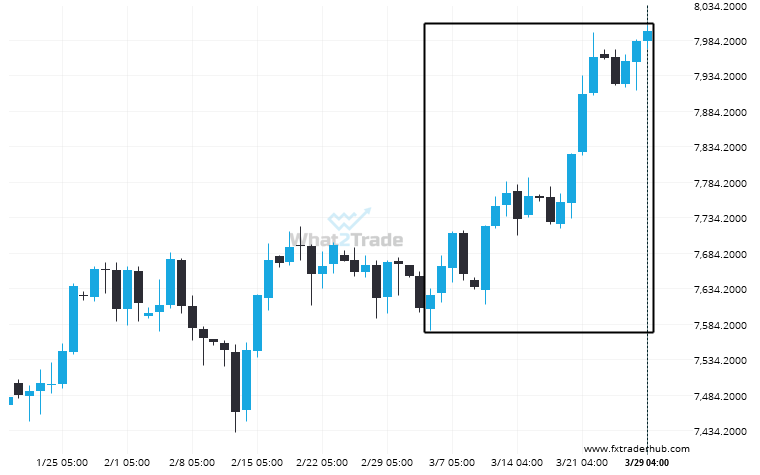
UK100 rose sharply for 24 days – which is an excessively big movement for this instrument; exceeding the 98% of past price moves. Even if this move is a sign of a new trend in UK100 there is a chance that we will witness a correction, no matter how brief.
Related Posts
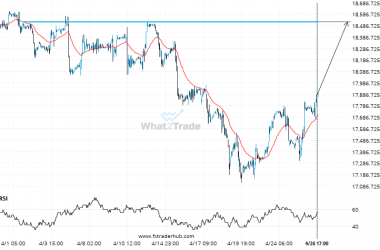
If NAS100 touches 18518.7500 it may be time to take action.
NAS100 is moving towards a key resistance level at 18518.7500. This is a previously tested level for NAS100.…
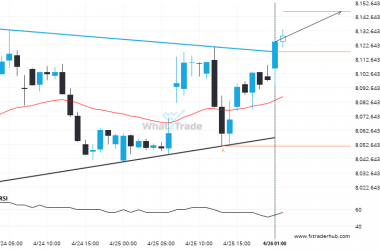
UK100 broke through a resistance at 2024-04-26T02:00:00.000Z, with the price momentum continuing to move in an upward direction over the next hours, good opportunity presents itself with the price expected to reach 8146.6030.
The breakout of UK100 through the resistance line of a Triangle could be a sign of the road…
US30 – approaching a price line that has been previously tested numerous times in the past
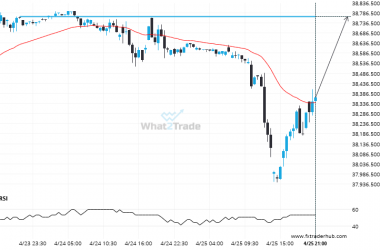
The movement of US30 towards 38767.0000 price line is yet another test of the line it reached numerous…

