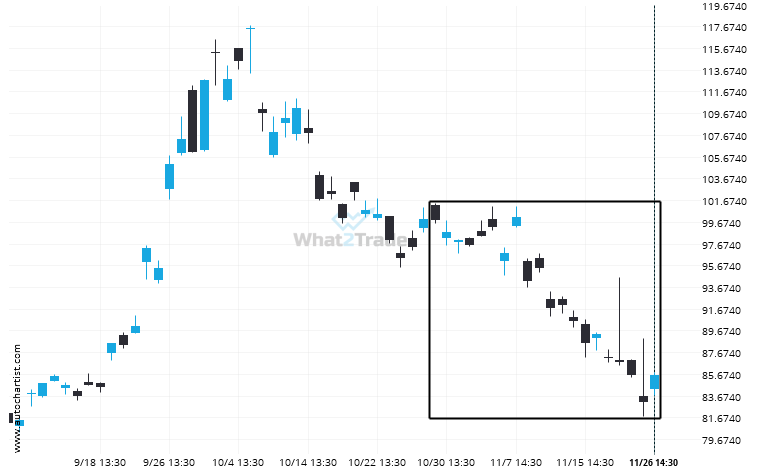
An unexpected large move has occurred on BABA Daily chart beginning at 99.83 and ending at 85.55. Is this a sign of something new? What can we expect in the future?
Related Posts
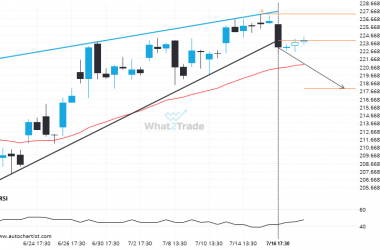
AMZN has broken through support of a Rising Wedge. It has touched this line at least twice in the last 31 days.
AMZN has broken through a support line of a Rising Wedge chart pattern. If this breakout holds true,…
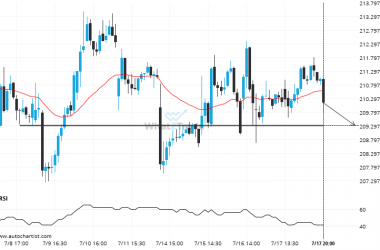
AAPL heading towards a price it has tested 5 times in the recent past.
AAPL is moving towards a line of 209.3100 which it has tested numerous times in the past. We…
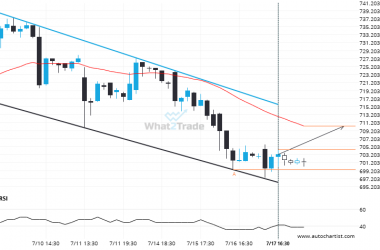
A Channel Down has formed, META is approaching support. Can we expect a breakout and the start of a new trend or a reversal?
META is moving towards a resistance line. Because we have seen it retrace from this line before, we…

