

Browsing Category
Uncategorized
616 posts
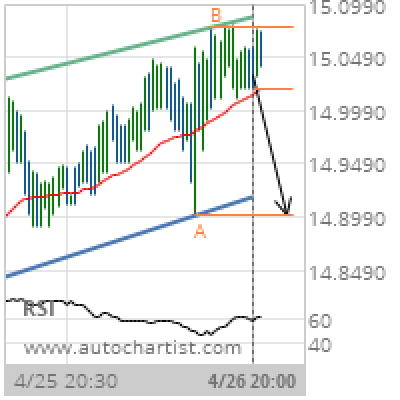
XAG/USD Target Level: 14.9000
Channel Up identified at 26-Apr-2019 20:00 UTC. This pattern is still in the process of forming. Possible bearish price movement towards the support 14.9000 within the next 16 hours. Supported by RSI above 60 Chart 30 MinutesPattern Channel UpLength 102 CandlesIdentified 26-Apr-2019 20:00 UTC
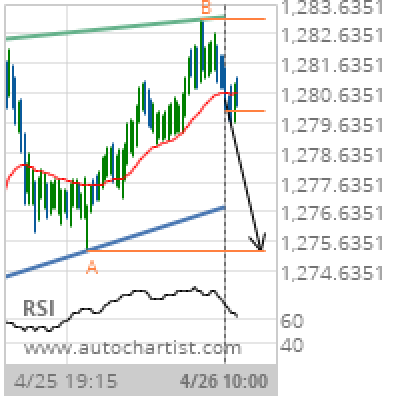
XAU/USD Target Level: 1275.3400
Rising Wedge identified at 26-Apr-2019 10:00 UTC. This pattern is still in the process of forming. Possible bearish price movement towards the support 1275.3400 within the next 10 hours. Supported by RSI above 60 Chart 15 MinutesPattern Rising WedgeLength 130 CandlesIdentified 26-Apr-2019 10:00 UTC
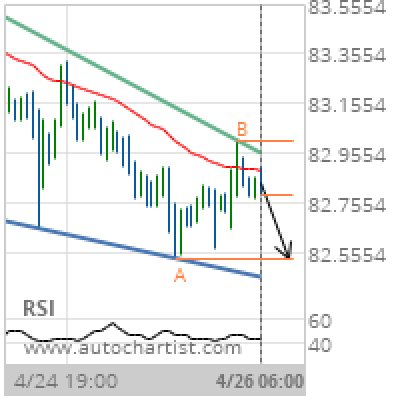
CAD/JPY Target Level: 82.5300
Falling Wedge identified at 26-Apr-2019 06:00 UTC. This pattern is still in the process of forming. Possible bearish price movement towards the support 82.5300 within the next day. Supported by Downward sloping Moving Average Chart 1 hourPattern Falling WedgeLength 77 CandlesIdentified 26-Apr-2019 06:00 UTC
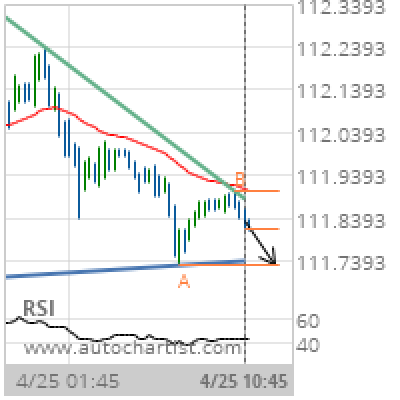
USD/JPY Target Level: 111.7300
Triangle identified at 25-Apr-2019 10:45 UTC. This pattern is still in the process of forming. Possible bearish price movement towards the support 111.7300 within the next 7 hours. Supported by Downward sloping Moving Average Chart 15 MinutesPattern TriangleLength 81 CandlesIdentified 25-Apr-2019 10:45 UTC
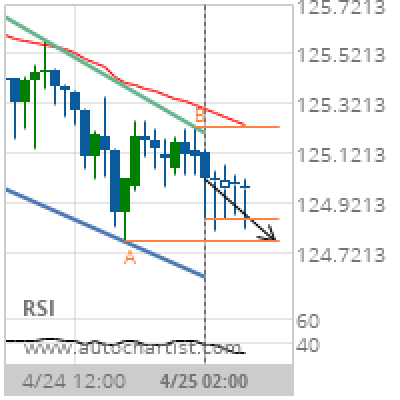
EUR/JPY Target Level: 124.7700
Channel Down identified at 25-Apr-2019 02:00 UTC. This pattern is still in the process of forming. Possible bearish price movement towards the support 124.7700 within the next 7 hours. Supported by Downward sloping Moving Average Chart 1 hourPattern Channel DownLength 35 CandlesIdentified 25-Apr-2019 02:00 UTC
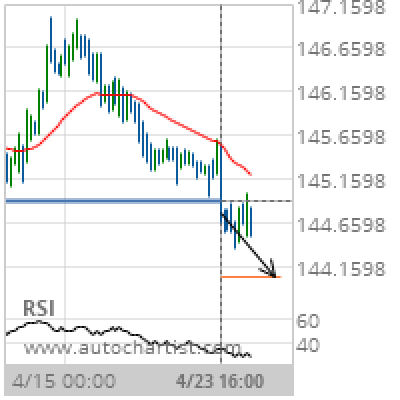
GBP/JPY Target Level: 144.0562
Broke through Support level of 144.9180 at 23-Apr-2019 16:00 UTC Supported by Downward sloping Moving Average Chart 4 hourPattern SupportLength 95 CandlesIdentified 23-Apr-2019 16:00 UTC
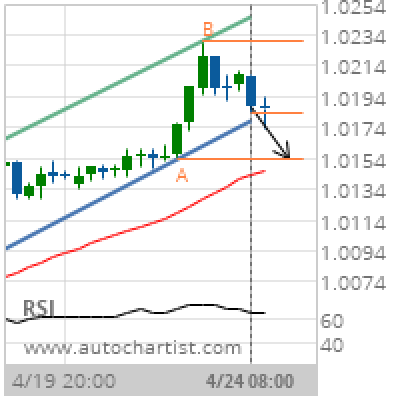
USD/CHF Target Level: 1.0154
Channel Up identified at 24-Apr-2019 08:00 UTC. This pattern is still in the process of forming. Possible bearish price movement towards the support 1.0154 within the next 2 days. Supported by RSI above 60 Chart 4 hourPattern Channel UpLength 36 CandlesIdentified 24-Apr-2019 08:00 UTC
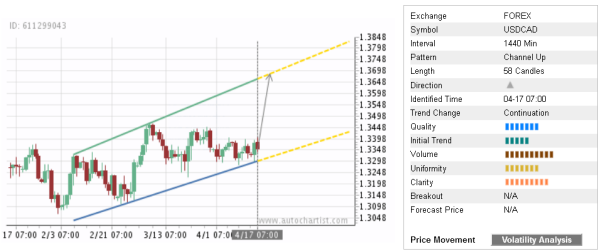
Trade of the Day: USD/CAD
By: Dima Chernovolov USD/CAD continues to rise inside the daily Up Channel which was recently identified by Autochartist. Autochartist rates the quality of daily this Up Channel at the 7-bar level – which is the result of the average Initial Trend (5 bars), significant Uniformity (7 bars) and near-maximum Clarity (9 bars). USD/CAD is expected…
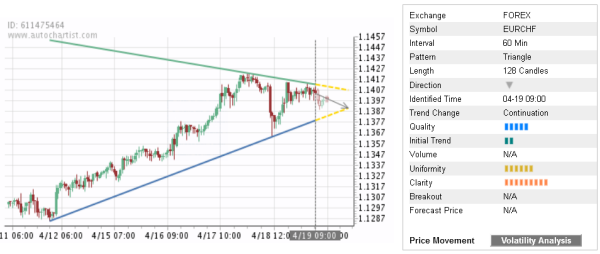
Trade of the Day: EUR/CHF
By: Dima Chernovolov EUR/CHF continues to fall inside the hourly Triangle chart pattern which was recently identified by Autochartist. Autochartist rates the quality of daily this Triangle at the 5-bar level – which is the result of the slow Initial Trend (2 bars), above-average Uniformity (6 bars) and near-maximum Clarity (9 bars). EUR/CHF is expected…
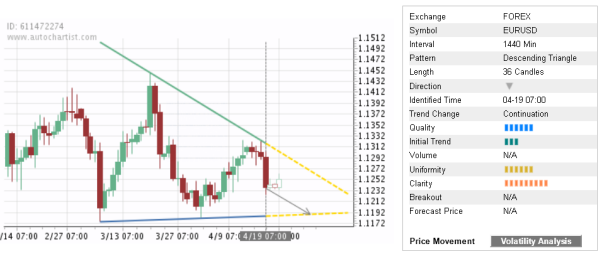
Trade of the Day: EUR/USD
By: Dima Chernovolov EUR/USD continues to fall inside the clear daily Descending Triangle chart pattern which was recently identified by Autochartist. Autochartist rates the quality of daily this Descending Triangle at the 6-bar level – which is the result of the lower Initial Trend (3 bars), above-average Uniformity (6 bars) and near-maximum Clarity (9 bars).…