

Browsing Category
Uncategorized
616 posts
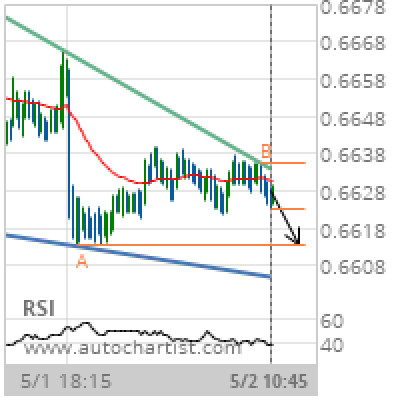
NZD/USD Target Level: 0.6613
Falling Wedge identified at 02-May-2019 10:45 UTC. This pattern is still in the process of forming. Possible bearish price movement towards the support 0.6613 within the next 12 hours. Supported by Downward sloping Moving Average Chart 15 MinutesPattern Falling WedgeLength 143 CandlesIdentified 02-May-2019 10:45 UTC
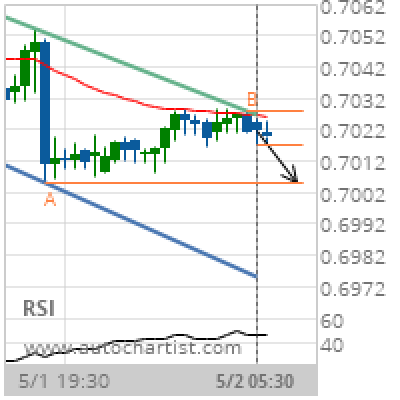
AUD/USD Target Level: 0.7005
Channel Down identified at 02-May-2019 05:30 UTC. This pattern is still in the process of forming. Possible bearish price movement towards the support 0.7005 within the next 7 hours. Supported by Downward sloping Moving Average Chart 30 MinutesPattern Channel DownLength 44 CandlesIdentified 02-May-2019 05:30 UTC
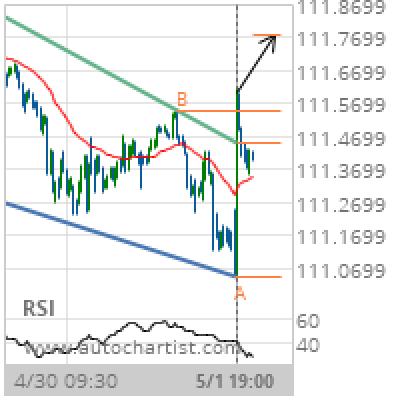
USD/JPY Target Level: 111.7741
Falling Wedge has broken through the resistance line at 01-May-2019 19:00 UTC. Possible bullish price movement forecast for the next 22 hours towards 111.7741. Supported by RSI below 40 Chart 30 MinutesPattern Falling WedgeLength 152 CandlesIdentified 01-May-2019 19:00 UTC
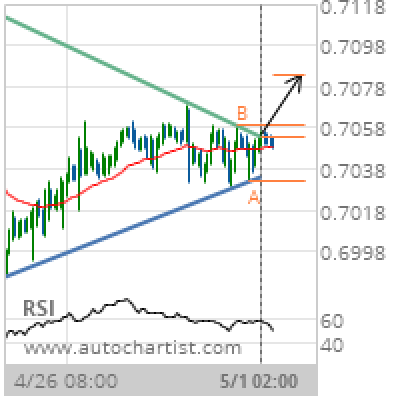
AUD/USD Target Level: 0.7083
Triangle has broken through the resistance line at 01-May-2019 02:00 UTC. Possible bullish price movement forecast for the next 2 days towards 0.7083. Supported by Upward sloping Moving Average Chart 1 hourPattern TriangleLength 145 CandlesIdentified 01-May-2019 02:00 UTC
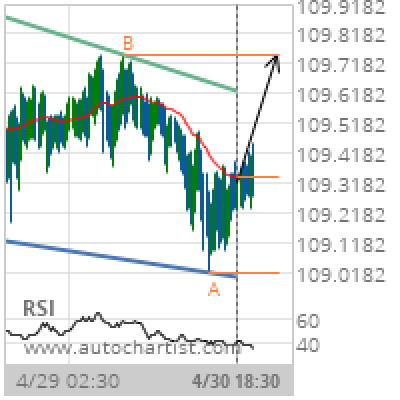
CHF/JPY Target Level: 109.7500
Falling Wedge identified at 30-Apr-2019 18:30 UTC. This pattern is still in the process of forming. Possible bullish price movement towards the resistance 109.7500 within the next day. Supported by RSI below 40 Chart 30 MinutesPattern Falling WedgeLength 186 CandlesIdentified 30-Apr-2019 18:30 UTC
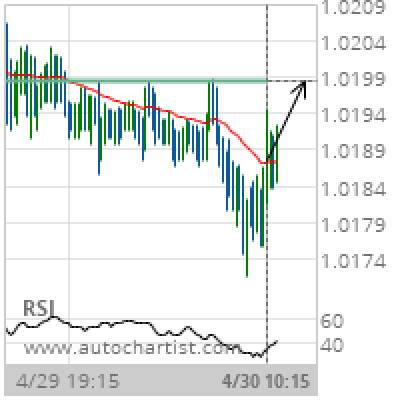
USD/CHF Target Level: 1.0199
Approaching Resistance level of 1.0199 identified at 30-Apr-2019 10:15 UTC Supported by Upward sloping Moving Average Chart 15 MinutesPattern ResistanceLength 132 CandlesIdentified 30-Apr-2019 10:15 UTC
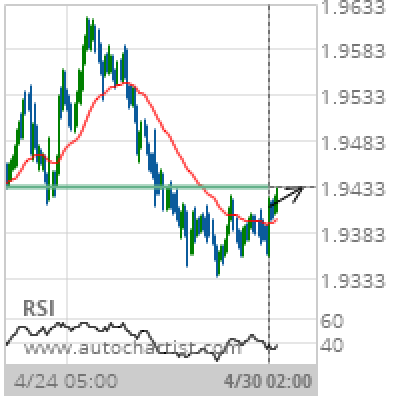
GBP/NZD Target Level: 1.9433
Approaching Resistance level of 1.9433 identified at 30-Apr-2019 02:00 UTC Supported by RSI below 40 Chart 1 hourPattern ResistanceLength 203 CandlesIdentified 30-Apr-2019 02:00 UTC
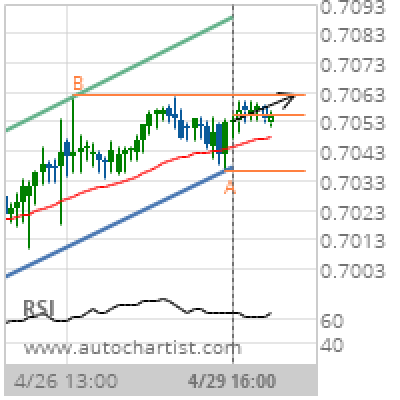
AUD/USD Target Level: 0.7061
Channel Up identified at 29-Apr-2019 16:00 UTC. This pattern is still in the process of forming. Possible bullish price movement towards the resistance 0.7061 within the next 14 hours. Supported by Upward sloping Moving Average Chart 1 hourPattern Channel UpLength 61 CandlesIdentified 29-Apr-2019 16:00 UTC
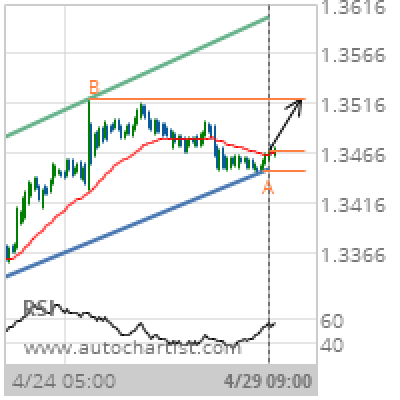
USD/CAD Target Level: 1.3521
Channel Up identified at 29-Apr-2019 09:00 UTC. This pattern is still in the process of forming. Possible bullish price movement towards the resistance 1.3521 within the next 2 days. Supported by Upward sloping Moving Average Chart 1 hourPattern Channel UpLength 164 CandlesIdentified 29-Apr-2019 09:00 UTC
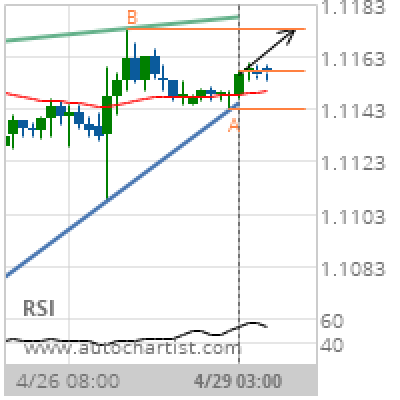
EUR/USD Target Level: 1.1174
Rising Wedge identified at 29-Apr-2019 03:00 UTC. This pattern is still in the process of forming. Possible bullish price movement towards the resistance 1.1174 within the next 11 hours. Supported by Upward sloping Moving Average Chart 1 hourPattern Rising WedgeLength 44 CandlesIdentified 29-Apr-2019 03:00 UTC