
Browsing Category
Uncategorized
616 posts
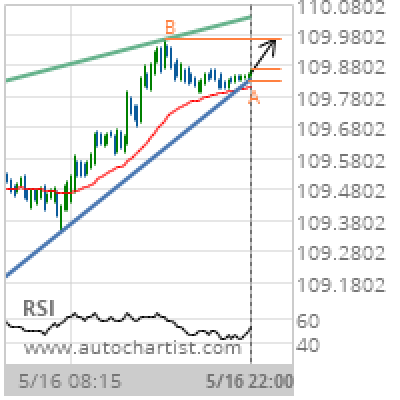
USD/JPY Target Level: 109.9660
Rising Wedge identified at 16-May-2019 22:00 UTC. This pattern is still in the process of forming. Possible bullish price movement towards the resistance 109.9660 within the next 11 hours. Supported by Upward sloping Moving Average Chart 15 MinutesPattern Rising WedgeLength 125 CandlesIdentified 16-May-2019 22:00 UTC
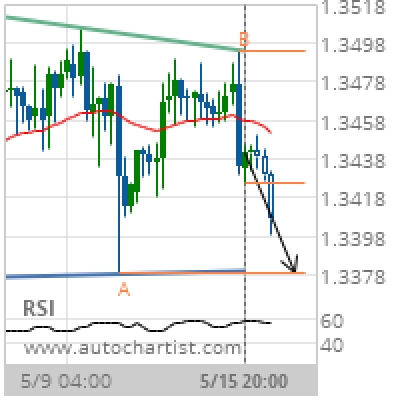
USD/CAD Target Level: 1.3378
Descending Triangle identified at 15-May-2019 20:00 UTC. This pattern is still in the process of forming. Possible bearish price movement towards the support 1.3378 within the next 3 days. Supported by Downward sloping Moving Average Chart 4 hourPattern Descending TriangleLength 66 CandlesIdentified 15-May-2019 20:00 UTC
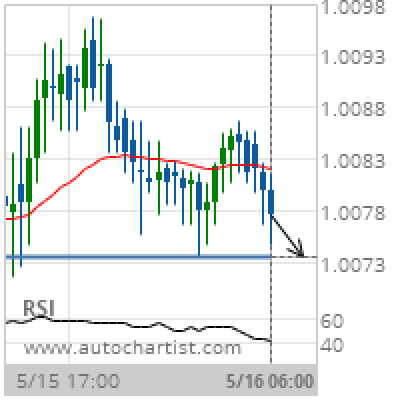
USD/CHF Target Level: 1.0074
Approaching Support level of 1.0074 identified at 16-May-2019 06:00 UTC Supported by Downward sloping Moving Average Chart 30 MinutesPattern SupportLength 58 CandlesIdentified 16-May-2019 06:00 UTC
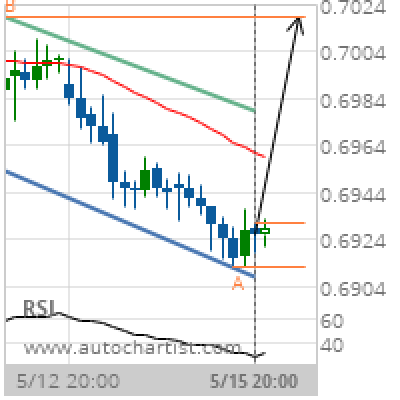
AUD/USD Target Level: 0.7018
Channel Down identified at 15-May-2019 20:00 UTC. This pattern is still in the process of forming. Possible bullish price movement towards the resistance 0.7018 within the next 2 days. Supported by RSI below 40 Chart 4 hourPattern Channel DownLength 40 CandlesIdentified 15-May-2019 20:00 UTC
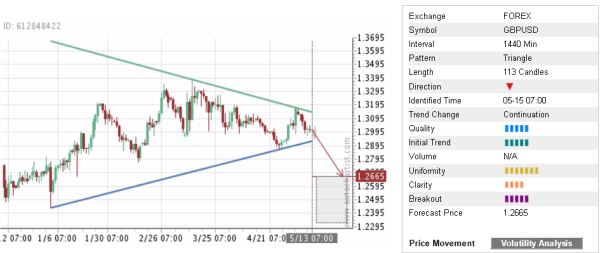
Trade of the Day: GBP/USD
By: Dima Chernovolov GBP/USD continues to fall after the recent breakout of the daily Triangle chart pattern which was recently identified by Autochartist. Autochartist rates the quality of this Triangle at the 5-bar level – which is the result of the average Initial Trend (5 bar), strong Uniformity (7 bars) and lower Clarity (4…
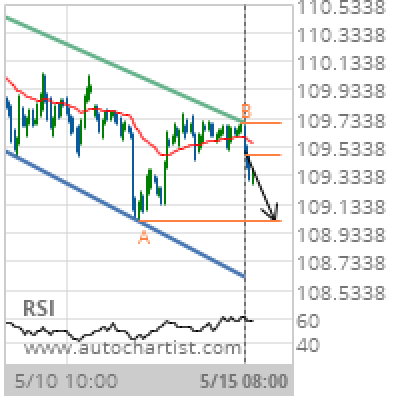
USD/JPY Target Level: 109.0140
Channel Down identified at 15-May-2019 08:00 UTC. This pattern is still in the process of forming. Possible bearish price movement towards the support 109.0140 within the next 2 days. Supported by Downward sloping Moving Average Chart 1 hourPattern Channel DownLength 157 CandlesIdentified 15-May-2019 08:00 UTC
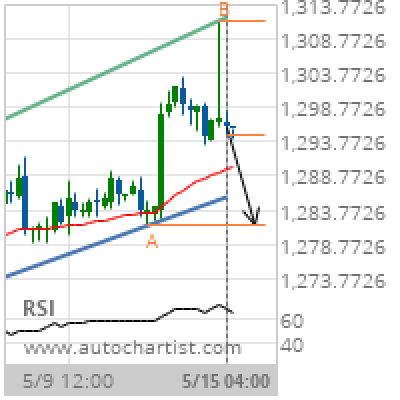
XAU/USD Target Level: 1281.6000
Channel Up identified at 15-May-2019 04:00 UTC. This pattern is still in the process of forming. Possible bearish price movement towards the support 1281.6000 within the next 3 days. Supported by RSI above 60 Chart 4 hourPattern Channel UpLength 53 CandlesIdentified 15-May-2019 04:00 UTC
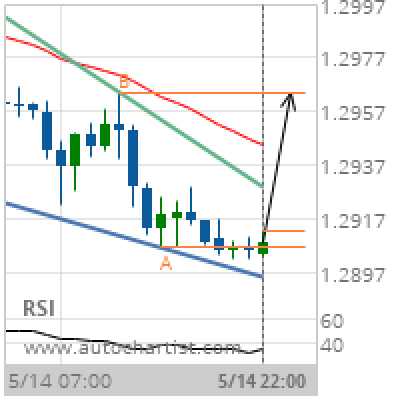
GBP/USD Target Level: 1.2964
Falling Wedge identified at 14-May-2019 22:00 UTC. This pattern is still in the process of forming. Possible bullish price movement towards the resistance 1.2964 within the next 10 hours. Supported by RSI below 40 Chart 1 hourPattern Falling WedgeLength 32 CandlesIdentified 14-May-2019 22:00 UTC
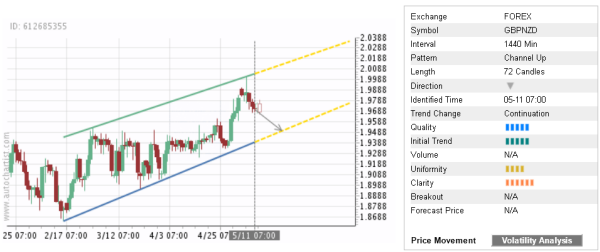
Trade of the Day: GBP/NZD
By: Dima Chernovolov GBP/NZD continues to fall inside the daily Up Channel chart pattern which was recently identified by Autochartist. Autochartist rates the quality of daily this Up Channel at the 5-bar level – which is the result of the average Initial Trend (5 bar), below-average Uniformity (4 bars) and higher Clarity (6 bars). GBP/NZD…
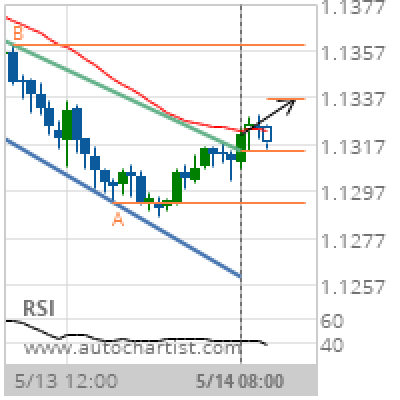
EUR/CHF Target Level: 1.1336
Channel Down has broken through the resistance line at 14-May-2019 08:00 UTC. Possible bullish price movement forecast for the next 11 hours towards 1.1336. Supported by RSI below 40 Chart 1 hourPattern Channel DownLength 45 CandlesIdentified 14-May-2019 08:00 UTC