

Browsing Category
Uncategorized
616 posts
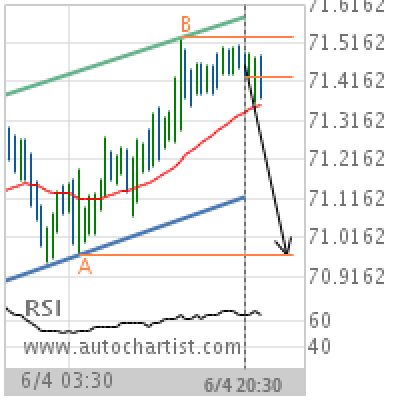
NZD/JPY Target Level: 70.9710
Channel Up identified at 04-Jun-2019 20:30 UTC. This pattern is still in the process of forming. Possible bearish price movement towards the support 70.9710 within the next 11 hours. Supported by RSI above 60 Chart 30 MinutesPattern Channel UpLength 78 CandlesIdentified 04-Jun-2019 20:30 UTC
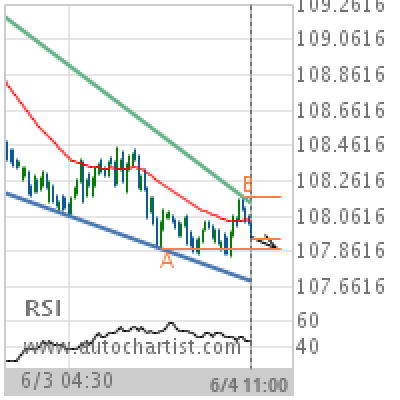
USD/JPY Target Level: 107.8800
Falling Wedge identified at 04-Jun-2019 11:00 UTC. This pattern is still in the process of forming. Possible bearish price movement towards the support 107.8800 within the next 23 hours. Supported by Downward sloping Moving Average Chart 30 MinutesPattern Falling WedgeLength 138 CandlesIdentified 04-Jun-2019 11:00 UTC
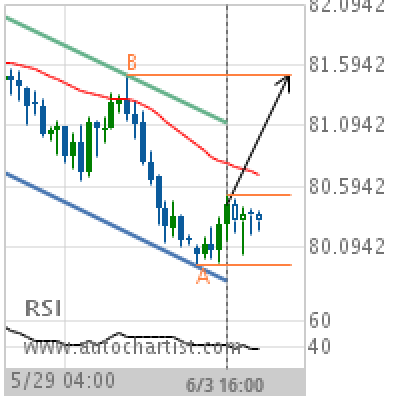
CAD/JPY Target Level: 81.5080
Channel Down identified at 03-Jun-2019 16:00 UTC. This pattern is still in the process of forming. Possible bullish price movement towards the resistance 81.5080 within the next 2 days. Supported by RSI below 40 Chart 4 hourPattern Channel DownLength 50 CandlesIdentified 03-Jun-2019 16:00 UTC
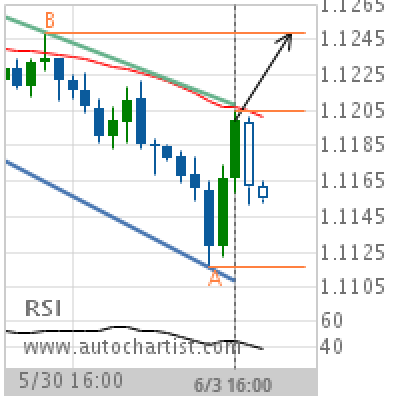
EUR/CHF Target Level: 1.1249
Channel Down identified at 03-Jun-2019 16:00 UTC. This pattern is still in the process of forming. Possible bullish price movement towards the resistance 1.1249 within the next day. Supported by RSI below 40 Chart 4 hourPattern Channel DownLength 30 CandlesIdentified 03-Jun-2019 16:00 UTC
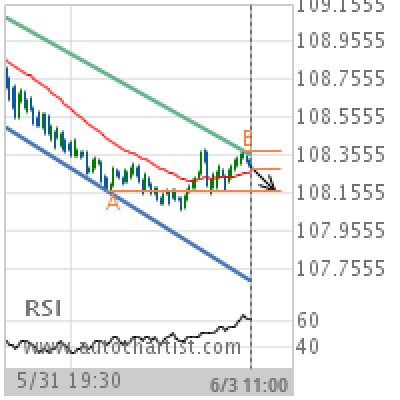
USD/JPY Target Level: 108.1660
Channel Down identified at 03-Jun-2019 11:00 UTC. This pattern is still in the process of forming. Possible bearish price movement towards the support 108.1660 within the next 12 hours. Supported by RSI above 60 Chart 15 MinutesPattern Channel DownLength 142 CandlesIdentified 03-Jun-2019 11:00 UTC
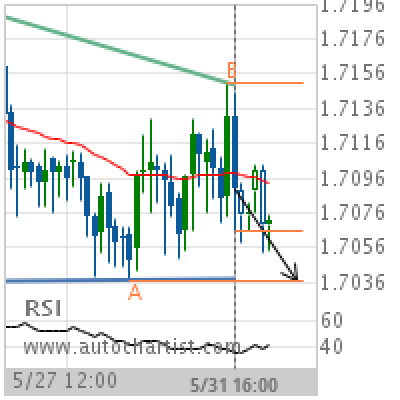
EUR/NZD Target Level: 1.7037
Descending Triangle identified at 31-May-2019 16:00 UTC. This pattern is still in the process of forming. Possible bearish price movement towards the support 1.7037 within the next 10 hours. Supported by Downward sloping Moving Average Chart 4 hourPattern Descending TriangleLength 57 CandlesIdentified 31-May-2019 16:00 UTC
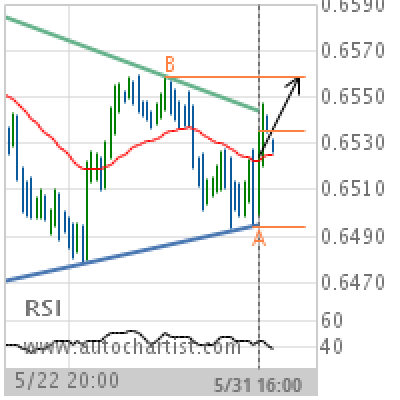
NZD/USD Target Level: 0.6558
Triangle identified at 31-May-2019 16:00 UTC. This pattern is still in the process of forming. Possible bullish price movement towards the resistance 0.6558 within the next 3 days. Supported by RSI below 40 Chart 4 hourPattern TriangleLength 93 CandlesIdentified 31-May-2019 16:00 UTC
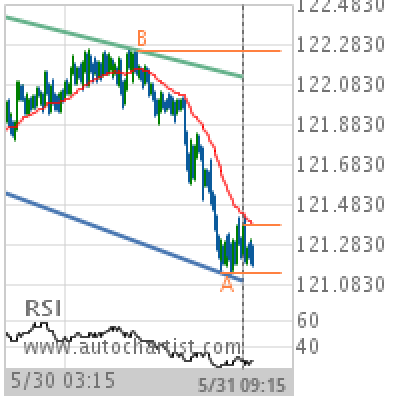
EUR/JPY Target Level: 122.2500
Channel Down identified at 31-May-2019 09:15 UTC. This pattern is still in the process of forming. Possible bullish price movement towards the resistance 122.2500 within the next 21 hours. Supported by RSI below 40 Chart 15 MinutesPattern Channel DownLength 268 CandlesIdentified 31-May-2019 09:15 UTC
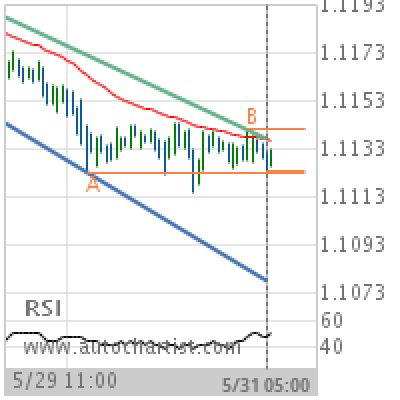
EUR/USD Target Level: 1.1123
Channel Down identified at 31-May-2019 05:00 UTC. This pattern is still in the process of forming. Possible bearish price movement towards the support 1.1123 within the next day. Supported by Downward sloping Moving Average Chart 1 hourPattern Channel DownLength 92 CandlesIdentified 31-May-2019 05:00 UTC
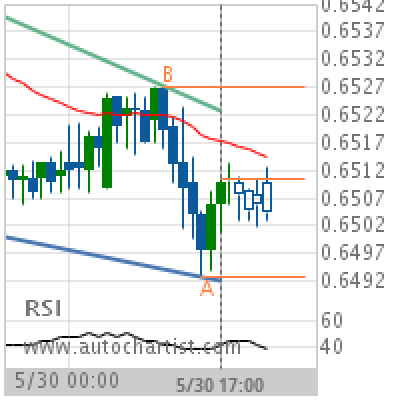
NZD/USD Target Level: 0.6527
Falling Wedge identified at 30-May-2019 17:00 UTC. This pattern is still in the process of forming. Possible bullish price movement towards the resistance 0.6527 within the next 8 hours. Supported by RSI below 40 Chart 1 hourPattern Falling WedgeLength 40 CandlesIdentified 30-May-2019 17:00 UTC