
Browsing Category
Uncategorized
616 posts
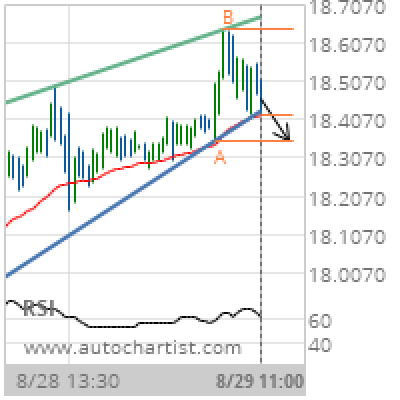
XAG/USD Target Level: 18.3500
Rising Wedge identified at 29-Aug-2019 11:00 UTC. This pattern is still in the process of forming. Possible bearish price movement towards the support 18.3500 within the next 15 hours. Supported by RSI above 60 Chart 30 MinutesPattern Rising WedgeLength 93 CandlesIdentified 29-Aug-2019 11:00 UTC
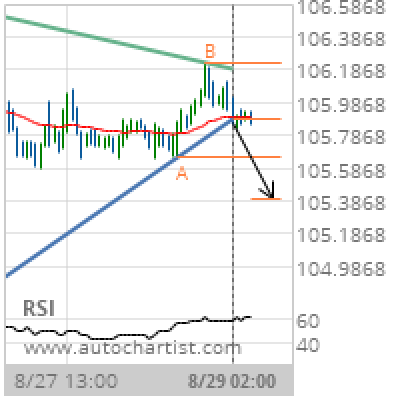
USD/JPY Target Level: 105.3999
Triangle has broken through the support line at 29-Aug-2019 02:00 UTC. Possible bearish price movement forecast for the next 24 hours towards 105.3999. Supported by RSI above 60 Chart 1 hourPattern TriangleLength 85 CandlesIdentified 29-Aug-2019 02:00 UTC
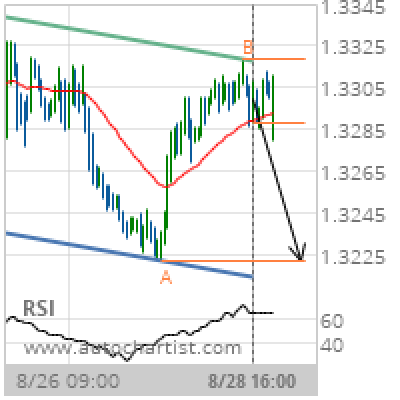
USD/CAD Target Level: 1.3222
Channel Down identified at 28-Aug-2019 16:00 UTC. This pattern is still in the process of forming. Possible bearish price movement towards the support 1.3222 within the next day. Supported by RSI above 60 Chart 1 hourPattern Channel DownLength 123 CandlesIdentified 28-Aug-2019 16:00 UTC
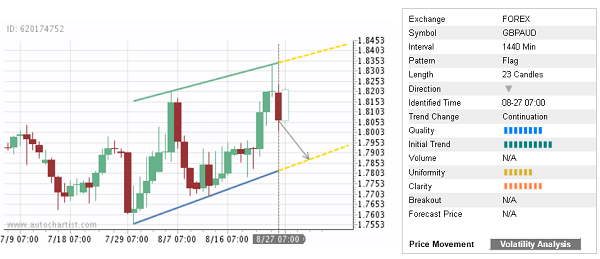
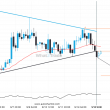
Trade of the Day: GBP/AUD
By: Dima Chernovolov GBP/AUD continues to fall inside the daily Flag chart pattern which was identified previously by Autochartist. Autochartist rates the quality of this Flag at the 8-bar level – which reflects the sharp Initial Trend (10 bars), above-average Uniformity (6 bars) and strong Clarity (8 bars). GBP/AUD is expected to fall further inside…
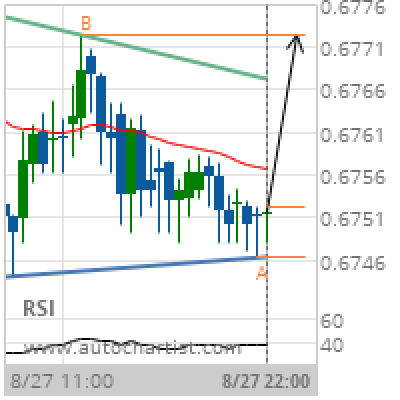
AUD/USD Target Level: 0.6772
Triangle identified at 27-Aug-2019 22:00 UTC. This pattern is still in the process of forming. Possible bullish price movement towards the resistance 0.6772 within the next 8 hours. Supported by RSI below 40 Chart 30 MinutesPattern TriangleLength 47 CandlesIdentified 27-Aug-2019 22:00 UTC
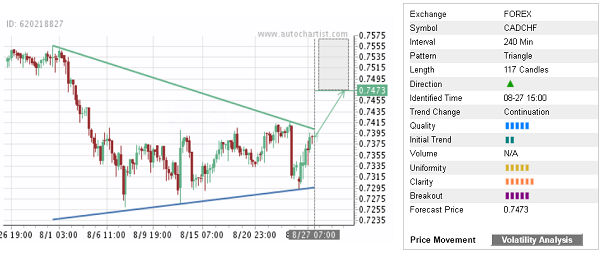
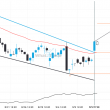
Trade of the Day: CAD/CHF
By: Dima Chernovolov CAD/CHF continues to rise after the recent breakout of the 4-hour Triangle chart pattern which was previously by Autochartist. Autochartist rates the quality of this Triangle at the 5-bar level – which reflects the slow Initial Trend (2 bars), average Uniformity (5 bars) and higher Clarity (6 bars). CAD/CHF is expected to…
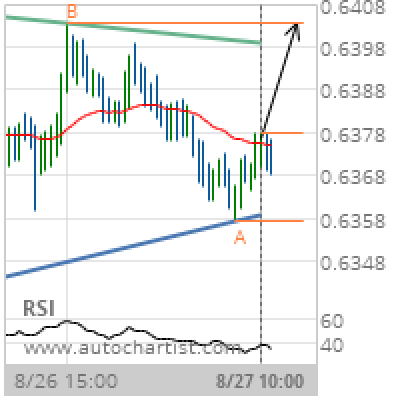
NZD/USD Target Level: 0.6403
Triangle identified at 27-Aug-2019 10:00 UTC. This pattern is still in the process of forming. Possible bullish price movement towards the resistance 0.6403 within the next 13 hours. Supported by RSI below 40 Chart 30 MinutesPattern TriangleLength 84 CandlesIdentified 27-Aug-2019 10:00 UTC
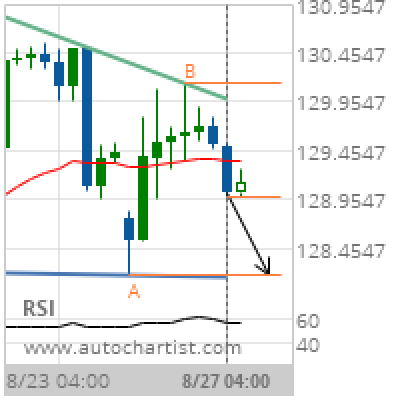
GBP/JPY Target Level: 128.1810
Descending Triangle identified at 27-Aug-2019 04:00 UTC. This pattern is still in the process of forming. Possible bearish price movement towards the support 128.1810 within the next day. Supported by Downward sloping Moving Average Chart 4 hourPattern Descending TriangleLength 29 CandlesIdentified 27-Aug-2019 04:00 UTC
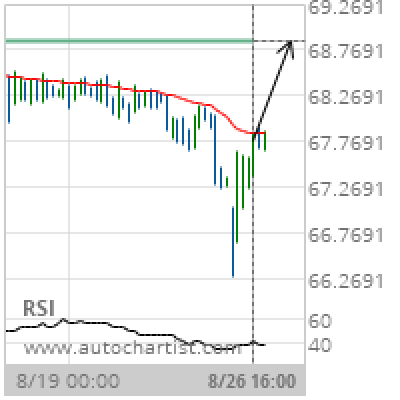
NZD/JPY Target Level: 68.8750
Approaching Resistance level of 68.8750 identified at 26-Aug-2019 16:00 UTC Supported by RSI below 40 Chart 4 hourPattern ResistanceLength 79 CandlesIdentified 26-Aug-2019 16:00 UTC
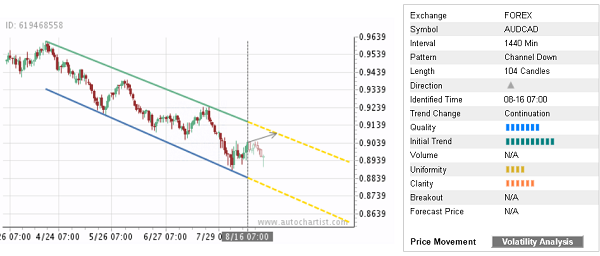
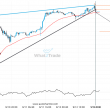
Trade of the Day: AUD/CAD
By: Dima Chernovolov AUD/CAD continues to rise inside the daily Down Channel chart pattern which was previously previously by Autochartist. Autochartist rates the quality of this Down Channel at the 7-bar level – which reflects the sharp Initial Trend (9 bars), below-average Uniformity (4 bars) and higher Clarity (6 bars). AUD/CAD is expected to rise…