
Browsing Category
Uncategorized
616 posts
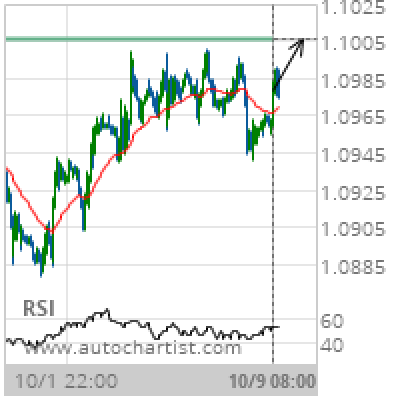
EUR/USD Target Level: 1.1005
Approaching Resistance level of 1.1005 identified at 09-Oct-2019 08:00 UTC Supported by Upward sloping Moving Average Chart 1 hourPattern ResistanceLength 281 CandlesIdentified 09-Oct-2019 08:00 UTC
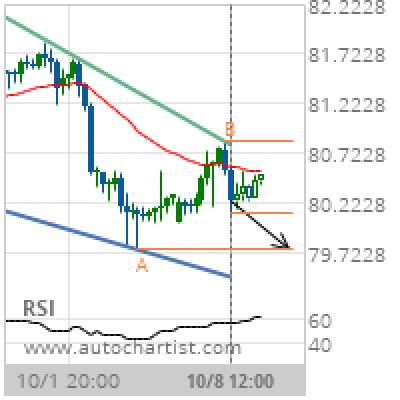
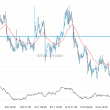
CAD/JPY Target Level: 79.7500
Falling Wedge identified at 08-Oct-2019 12:00 UTC. This pattern is still in the process of forming. Possible bearish price movement towards the support 79.7500 within the next 3 days. Supported by RSI above 60 Chart 4 hourPattern Falling WedgeLength 68 CandlesIdentified 08-Oct-2019 12:00 UTC
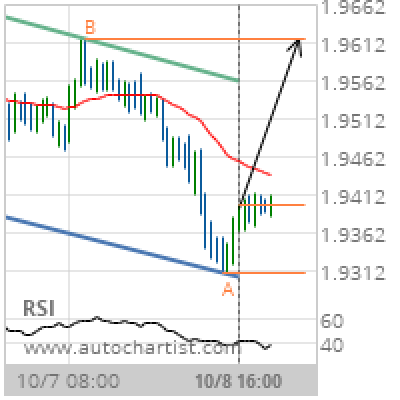
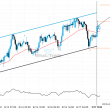
GBP/NZD Target Level: 1.9616
Channel Down identified at 08-Oct-2019 16:00 UTC. This pattern is still in the process of forming. Possible bullish price movement towards the resistance 1.9616 within the next 18 hours. Supported by RSI below 40 Chart 1 hourPattern Channel DownLength 74 CandlesIdentified 08-Oct-2019 16:00 UTC
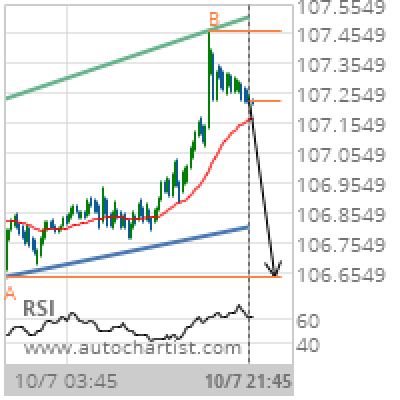
USD/JPY Target Level: 106.6400
Channel Up identified at 07-Oct-2019 21:45 UTC. This pattern is still in the process of forming. Possible bearish price movement towards the support 106.6400 within the next 11 hours. Supported by RSI above 60 Chart 15 MinutesPattern Channel UpLength 132 CandlesIdentified 07-Oct-2019 21:45 UTC
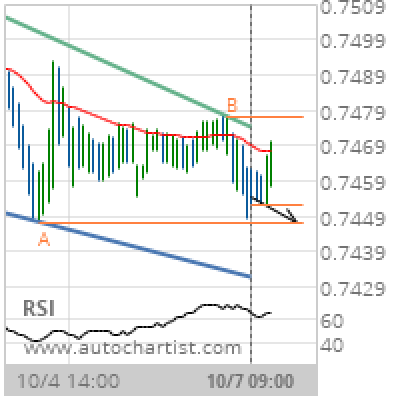
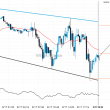
CAD/CHF Target Level: 0.7447
Falling Wedge identified at 07-Oct-2019 09:00 UTC. This pattern is still in the process of forming. Possible bearish price movement towards the support 0.7447 within the next 12 hours. Supported by RSI above 60 Chart 30 MinutesPattern Falling WedgeLength 85 CandlesIdentified 07-Oct-2019 09:00 UTC
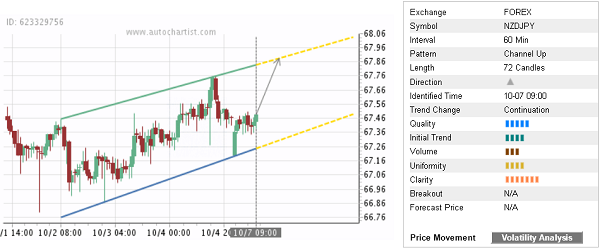
Trade of the Day: NZD/JPY
By: Dima Chernovolov NZD/JPY continues to rise inside the hourly Up Channel chart pattern which was identified recently by Autochartist. Autochartist rates the quality of this Up Channel at the 5-bar level – which reflects the below-average Initial Trend (4 bars), medium Uniformity (4 bars) and significant Clarity (7 bars). NZD/JPY is expected to rise…
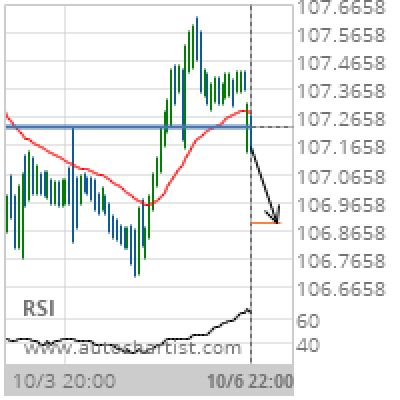
CHF/JPY Target Level: 106.8957
Broke through Support level of 107.2300 at 06-Oct-2019 22:00 UTC Supported by RSI above 60 Chart 30 MinutesPattern SupportLength 116 CandlesIdentified 06-Oct-2019 22:00 UTC
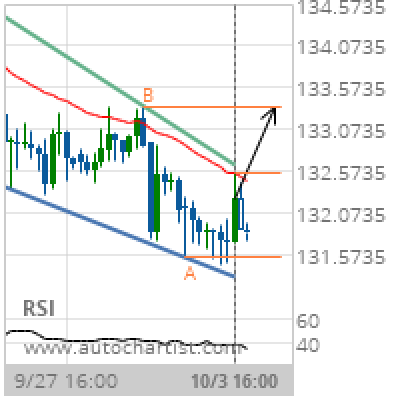
GBP/JPY Target Level: 133.3500
Falling Wedge identified at 03-Oct-2019 16:00 UTC. This pattern is still in the process of forming. Possible bullish price movement towards the resistance 133.3500 within the next 3 days. Supported by RSI below 40 Chart 4 hourPattern Falling WedgeLength 57 CandlesIdentified 03-Oct-2019 16:00 UTC
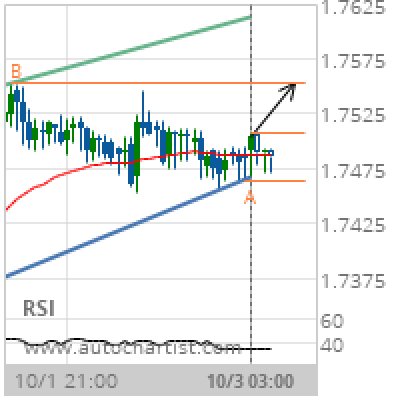
EUR/NZD Target Level: 1.7553
Channel Up identified at 03-Oct-2019 03:00 UTC. This pattern is still in the process of forming. Possible bullish price movement towards the resistance 1.7553 within the next 19 hours. Supported by RSI below 40 Chart 1 hourPattern Channel UpLength 68 CandlesIdentified 03-Oct-2019 03:00 UTC
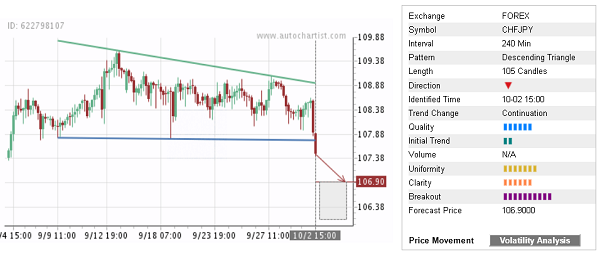
Trade of the Day: CHF/JPY
By: Dima Chernovolov CHF/JPY recently broke the 4-hour Descending Triangle chart pattern which was identified recently by Autochartist. Autochartist rates the quality of this Descending Triangle at the 6-bar level – which reflects the slow Initial Trend (2 bars), significant Uniformity (76 bars) an d above-average Clarity (6 bars). CHF/JPY is expected to fall further…