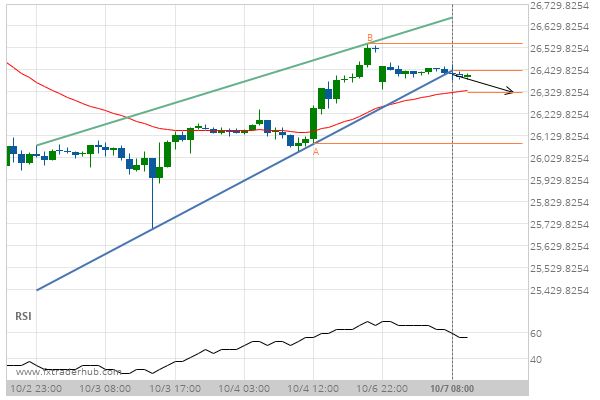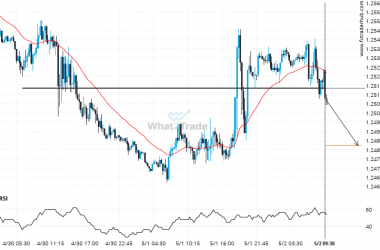
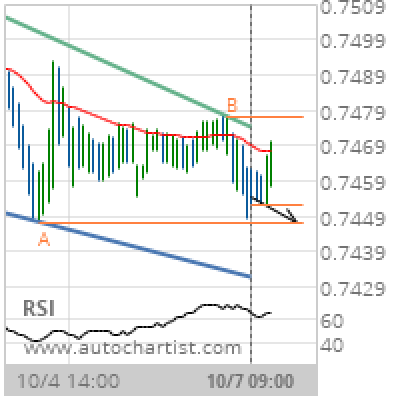

Falling Wedge identified at 07-Oct-2019 09:00 UTC. This pattern is still in the process of forming. Possible bearish price movement towards the support 0.7447 within the next 12 hours. Supported by RSI above 60
Chart 30 Minutes
Pattern Falling Wedge
Length 85 Candles
Identified 07-Oct-2019 09:00 UTC