


Browsing Category
Uncategorized
616 posts
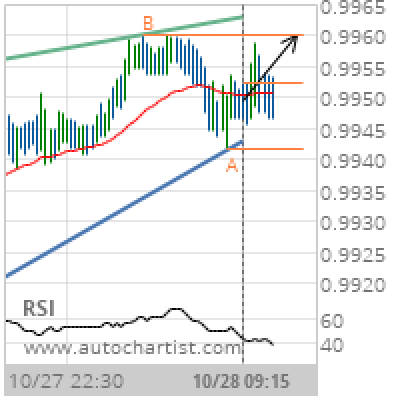
USD/CHF Target Level: 0.9960
Rising Wedge identified at 28-Oct-2019 09:15 UTC. This pattern is still in the process of forming. Possible bullish price movement towards the resistance 0.9960 within the next 7 hours. Supported by RSI below 40 Chart 15 MinutesPattern Rising WedgeLength 97 CandlesIdentified 28-Oct-2019 09:15 UTC
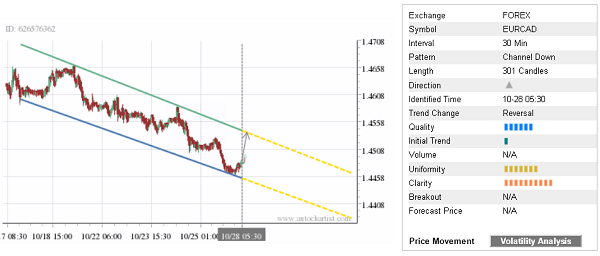
Trade of the Day: EUR/CAD
By: Dima Chernovolov EUR/CAD continues to rise inside the 30-minute Down Channel chart pattern which was identified previously by Autochartist. Autochartist rates the quality of this Down Channel at the 6-bar level – which is the result of the slow Initial Trend (1 bar), above-average Uniformity (6 bars) and maximum Clarity (10 bars). EUR/CAD is…
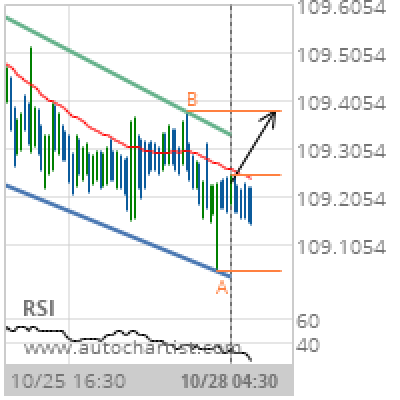
CHF/JPY Target Level: 109.3816
Channel Down identified at 28-Oct-2019 04:30 UTC. This pattern is still in the process of forming. Possible bullish price movement towards the resistance 109.3816 within the next 8 hours. Supported by RSI below 40 Chart 15 MinutesPattern Channel DownLength 112 CandlesIdentified 28-Oct-2019 04:30 UTC
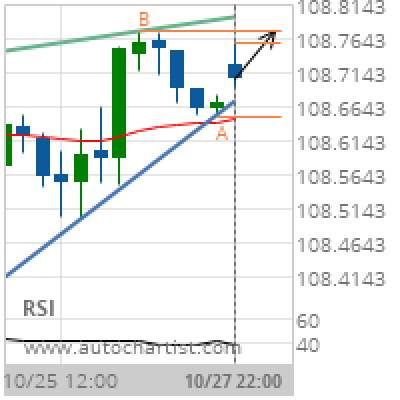
USD/JPY Target Level: 108.7740
Rising Wedge identified at 27-Oct-2019 22:00 UTC. This pattern is still in the process of forming. Possible bullish price movement towards the resistance 108.7740 within the next 6 hours. Supported by RSI below 40 Chart 1 hourPattern Rising WedgeLength 21 CandlesIdentified 27-Oct-2019 22:00 UTC
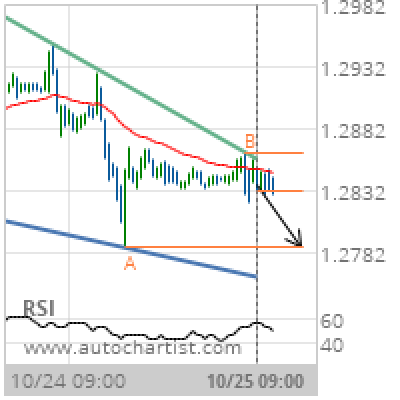
GBP/USD Target Level: 1.2786
Falling Wedge identified at 25-Oct-2019 09:00 UTC. This pattern is still in the process of forming. Possible bearish price movement towards the support 1.2786 within the next 16 hours. Supported by Downward sloping Moving Average Chart 30 MinutesPattern Falling WedgeLength 107 CandlesIdentified 25-Oct-2019 09:00 UTC
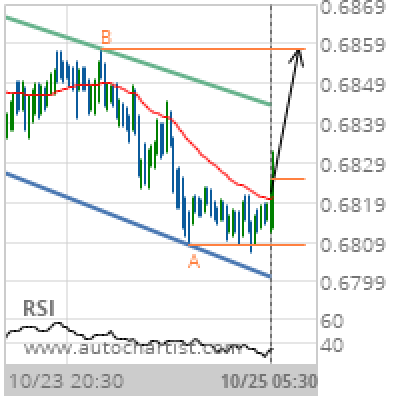
AUD/USD Target Level: 0.6857
Channel Down identified at 25-Oct-2019 05:30 UTC. This pattern is still in the process of forming. Possible bullish price movement towards the resistance 0.6857 within the next 23 hours. Supported by RSI below 40 Chart 30 MinutesPattern Channel DownLength 143 CandlesIdentified 25-Oct-2019 05:30 UTC
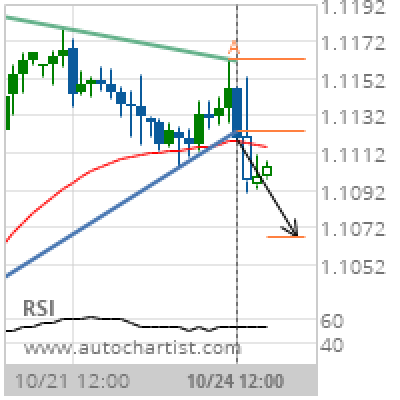
EUR/USD Target Level: 1.1067
Triangle has broken through the support line at 24-Oct-2019 12:00 UTC. Possible bearish price movement forecast for the next 2 days towards 1.1067. Supported by Downward sloping Moving Average Chart 4 hourPattern TriangleLength 41 CandlesIdentified 24-Oct-2019 12:00 UTC
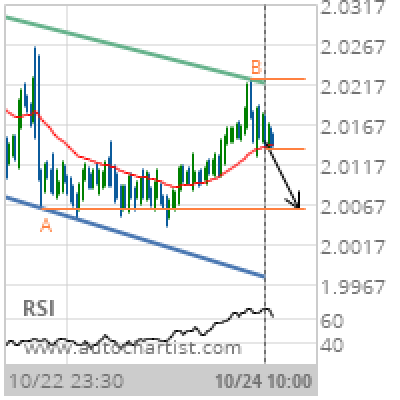
GBP/NZD Target Level: 2.0062
Channel Down identified at 24-Oct-2019 10:00 UTC. This pattern is still in the process of forming. Possible bearish price movement towards the support 2.0062 within the next day. Supported by RSI above 60 Chart 30 MinutesPattern Channel DownLength 152 CandlesIdentified 24-Oct-2019 10:00 UTC
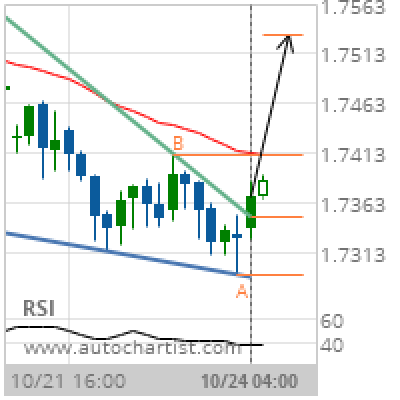
EUR/NZD Target Level: 1.7531
Falling Wedge has broken through the resistance line at 24-Oct-2019 04:00 UTC. Possible bullish price movement forecast for the next 2 days towards 1.7531. Supported by RSI below 40 Chart 4 hourPattern Falling WedgeLength 33 CandlesIdentified 24-Oct-2019 04:00 UTC
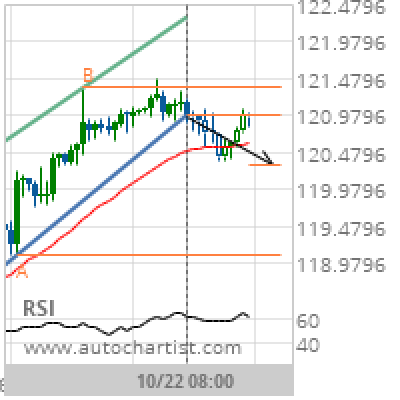
EUR/JPY Target Level: 120.3147
Channel Up has broken through the support line at 22-Oct-2019 08:00 UTC. Possible bearish price movement forecast for the next day towards 120.3147. Supported by RSI above 60 Chart 4 hourPattern Channel UpLength 51 CandlesIdentified 22-Oct-2019 08:00 UTC