


Browsing Category
Global Indices
7095 posts

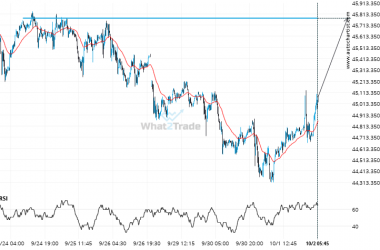
After testing 24489.3008 numerous times, DAX 40 is once again approaching this price point. Can we expect a bullish trend to follow?
The movement of DAX 40 towards 24489.3008 price line is yet another test of the line it reached…

NAS 100 – approaching a resistance line that has been previously tested at least twice in the past
The movement of NAS 100 towards the resistance line of a Rising Wedge is yet another test of…

Nikkei 225 reached 47590.0 after a 3.64% move spanning 3 days.
Nikkei 225 reached 47590.0 after a 3.64% move spanning 3 days.
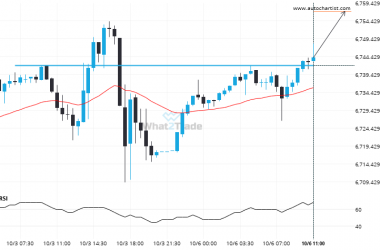
After testing 6741.8398 numerous times, US 500 has finally broken through. Can we expect a bullish trend to follow?
The price of US 500 in heading in the direction of 6757.0430. Despite the recent breakout through 6741.8398…
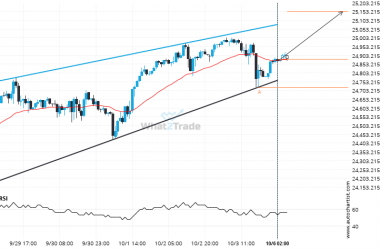
NAS 100 is approaching a resistance line of a Rising Wedge. It has touched this line numerous times in the last 11 days.
NAS 100 is heading towards the resistance line of a Rising Wedge. If this movement continues, the price…
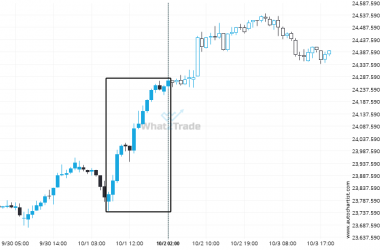
A very large move was recorded on DAX 40. The size of the shift is exceptional.
A movement of 1.93% over 19 hours on DAX 40 doesn’t go unnoticed. You may start considering where…

FTSE 100 reached 9451.85 after a 1.84% move spanning 2 days.
FTSE 100 recorded a considerable move in the last day — one of its biggest in recent sessions.

Big bullish swing on DAX 40 – this may be one of its more notable movements in the recent session.
DAX 40 reached 24232.6 after a 1.77% move spanning 11 hours.

DOW 30 is signaling a possible trend reversal on the intraday charts with price not breaching resistance.
DOW 30 was identified at around 46395.84 having recently rebounded of the resistance on the 1 hour data…
Nikkei 225 heading towards a price it has tested 5 times in the recent past.
A strong resistance level has been identified at 45777.0000 on the 15 Minutes Nikkei 225 chart. Nikkei 225…