
Browsing Category
Forex
5596 posts
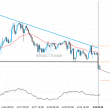
A quick move expected on USD/CAD as it starts approaching a resistance line of a Falling Wedge
USD/CAD is heading towards the resistance line of a Falling Wedge and could reach this point within the…
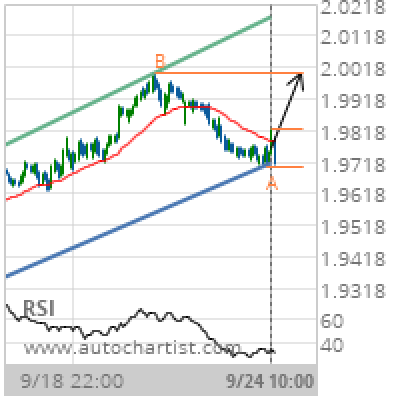
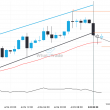
GBP/NZD Target Level: 2.0001
Channel Up identified at 24-Sep-2019 10:00 UTC. This pattern is still in the process of forming. Possible bullish price movement towards the resistance 2.0001 within the next 3 days. Supported by RSI below 40 Chart 1 hourPattern Channel UpLength 189 CandlesIdentified 24-Sep-2019 10:00 UTC
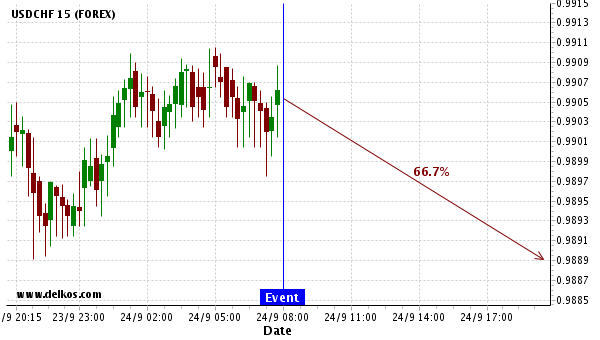
We expect USDCHF to trend downwards for the next 12 hours.
We expect USDCHF to trend downwards for the next 12 hours. Based on these past Germany Ifo Business…
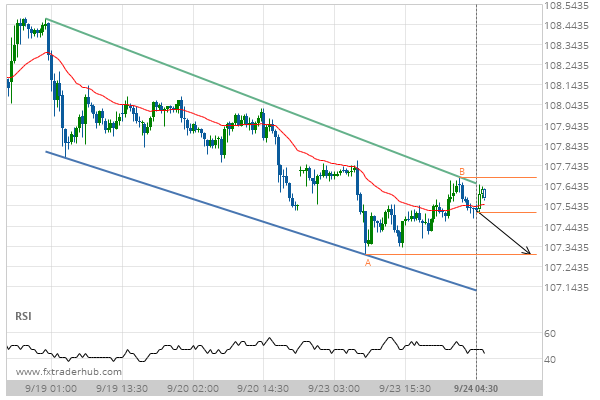
A quick move expected on USD/JPY as it starts approaching a support line of a Channel Down
USD/JPY is heading towards the support line of a Channel Down and could reach this point within the…
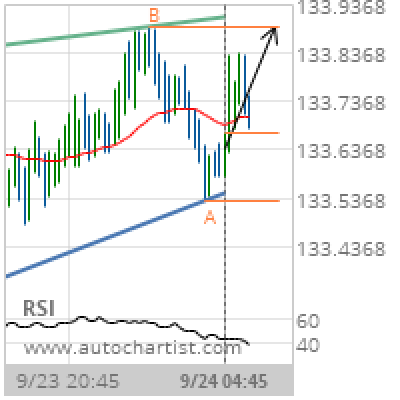
GBP/JPY Target Level: 133.8900
Rising Wedge identified at 24-Sep-2019 04:45 UTC. This pattern is still in the process of forming. Possible bullish price movement towards the resistance 133.8900 within the next 5 hours. Supported by RSI below 40 Chart 15 MinutesPattern Rising WedgeLength 75 CandlesIdentified 24-Sep-2019 04:45 UTC
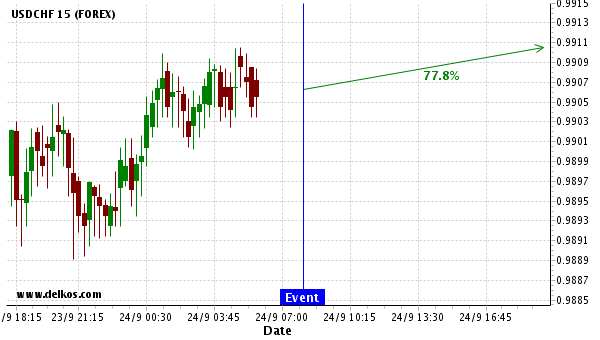
We expect a $494.65 movement on USDCHF within 12 hours following the event release at 24 Sep 08:00.
Based on the last 12 Ifo Business Climate events in Germany, we expect a $494.65 movement on USDCHF…
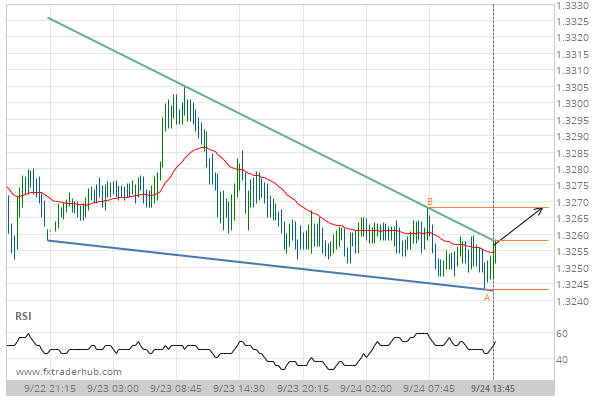
Important support line being approached by EUR/USD. This price has been tested numerous time in the last 6 days
EUR/USD is moving towards the support line of a Falling Wedge which it has tested numerous times in…
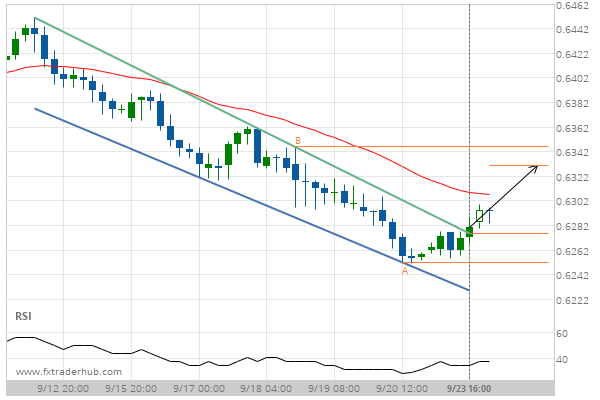
Breach of resistance could mean a start of a bullish trend on NZD/USD
NZD/USD has broken through a resistance line of a Channel Down chart pattern. If this breakout holds true,…
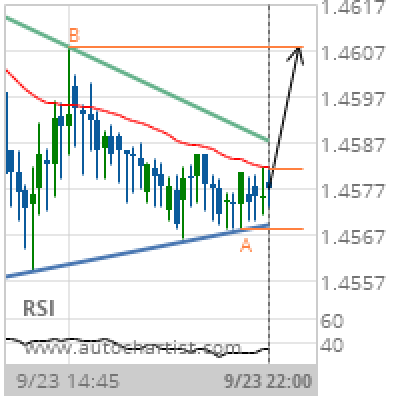
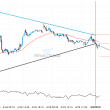
EUR/CAD Target Level: 1.4608
Triangle identified at 23-Sep-2019 22:00 UTC. This pattern is still in the process of forming. Possible bullish price movement towards the resistance 1.4608 within the next 5 hours. Supported by RSI below 40 Chart 15 MinutesPattern TriangleLength 63 CandlesIdentified 23-Sep-2019 22:00 UTC
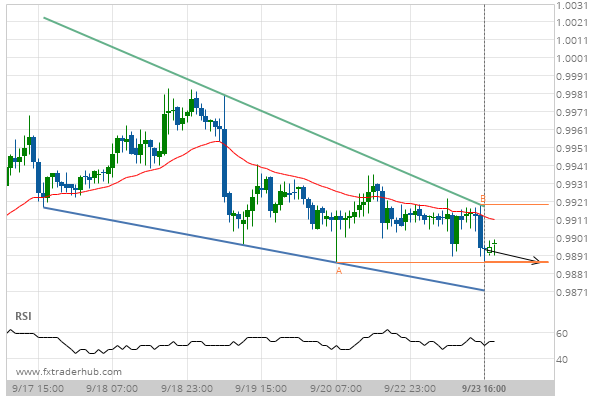
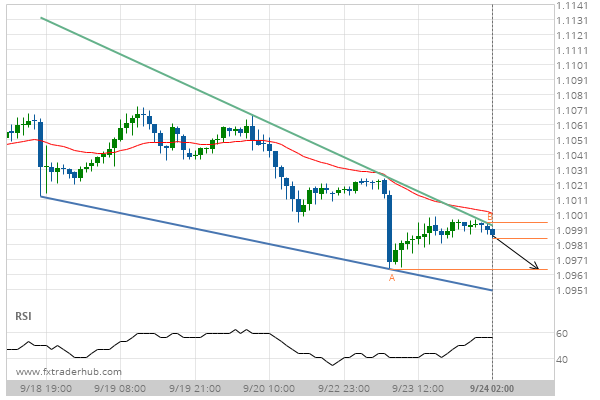
Important support line being approached by USD/CHF. This price has been tested numerous time in the last 7 days
USD/CHF is moving towards the support line of a Falling Wedge which it has tested numerous times in…