
Browsing Category
Forex
5666 posts
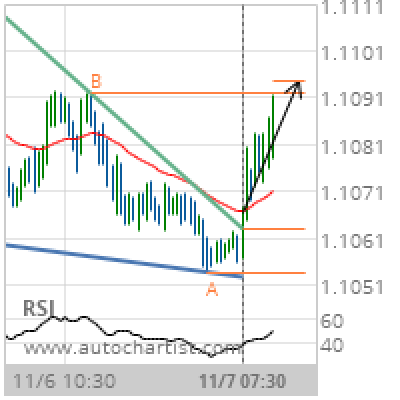
EUR/USD Target Level: 1.1095
Falling Wedge has broken through the resistance line at 07-Nov-2019 07:30 UTC. Possible bullish price movement forecast for the next 12 hours towards 1.1095. Supported by Upward sloping Moving Average Chart 30 MinutesPattern Falling WedgeLength 94 CandlesIdentified 07-Nov-2019 07:30 UTC
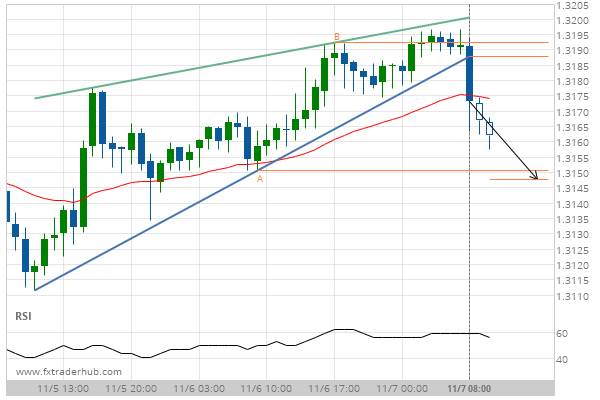
After testing support twice in the past, USD/CAD has finally broken through. Can we expect a bearish trend to follow?
The breakout of USD/CAD through the support line of a Rising Wedge could be a sign of the…
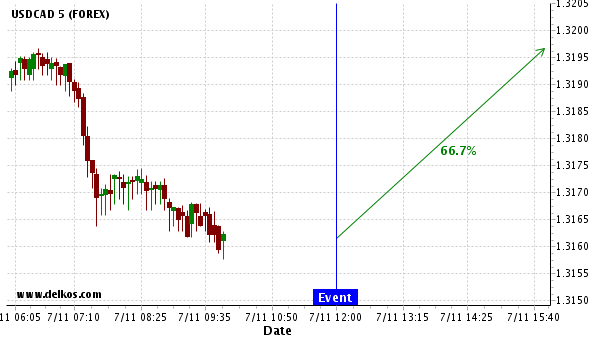
We expect a $250.711 movement on USDCAD within 4 hours following the event release at 07 Nov 12:00.
Based on the last 12 BoE Interest Rate Decision events in United Kingdom, we expect a $250.711 movement…
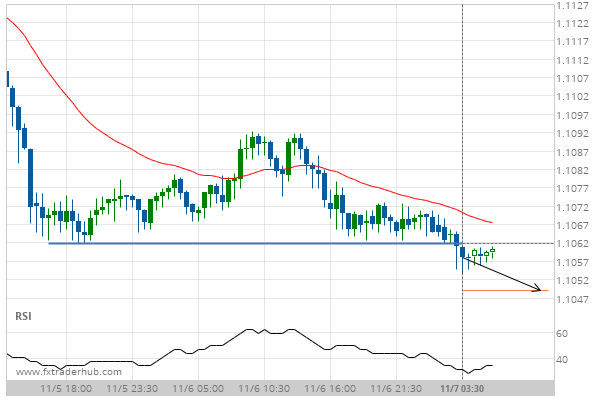
Breach of 1.1062 could mean a start of a bearish trend on EUR/USD
EUR/USD has broken through a line of 1.1062. If this breakout holds true, we expect the price of…
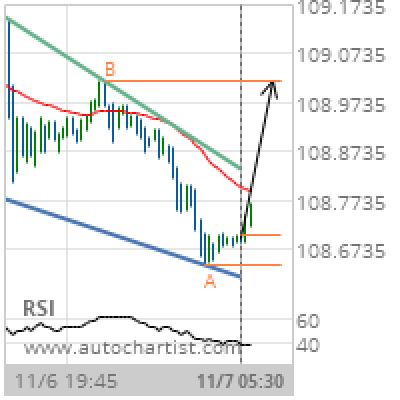
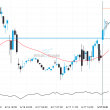
USD/JPY Target Level: 109.0150
Falling Wedge identified at 07-Nov-2019 05:30 UTC. This pattern is still in the process of forming. Possible bullish price movement towards the resistance 109.0150 within the next 7 hours. Supported by RSI below 40 Chart 15 MinutesPattern Falling WedgeLength 89 CandlesIdentified 07-Nov-2019 05:30 UTC
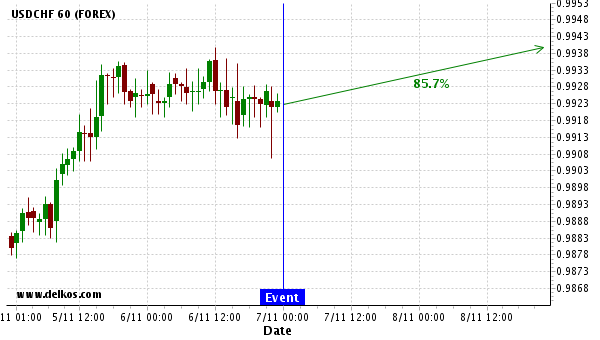
We expect a $423.221 movement on USDCHF within the next 48 hours.
Based on the last 12 Balance of Trade events in Australia, we expect a $423.221 movement on USDCHF…
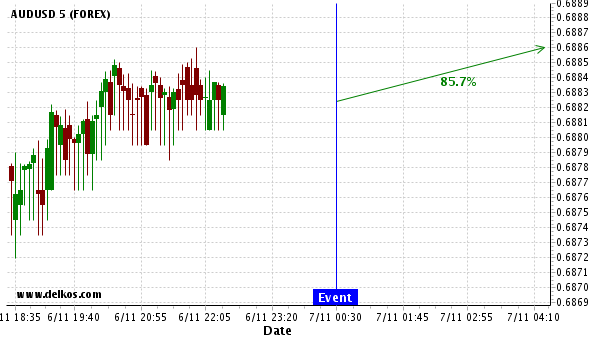
We expect a 49 pip movement on AUDUSD within 4 hours following the event release.
Based on the last 12 Balance of Trade events in Australia, we expect a 49 pip movement on…
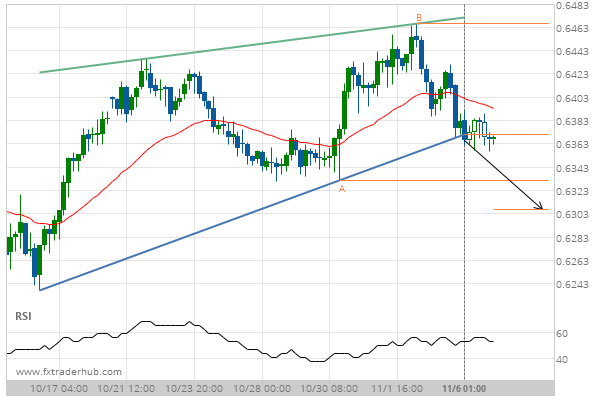
Breach of support could mean a start of a bearish trend on NZD/USD
NZD/USD has broken through a support line of a Rising Wedge chart pattern. If this breakout holds true,…
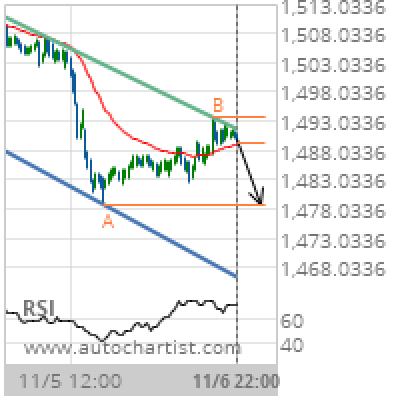
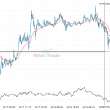
XAU/USD Target Level: 1478.8000
Channel Down identified at 06-Nov-2019 22:00 UTC. This pattern is still in the process of forming. Possible bearish price movement towards the support 1478.8000 within the next day. Supported by RSI above 60 Chart 30 MinutesPattern Channel DownLength 156 CandlesIdentified 06-Nov-2019 22:00 UTC
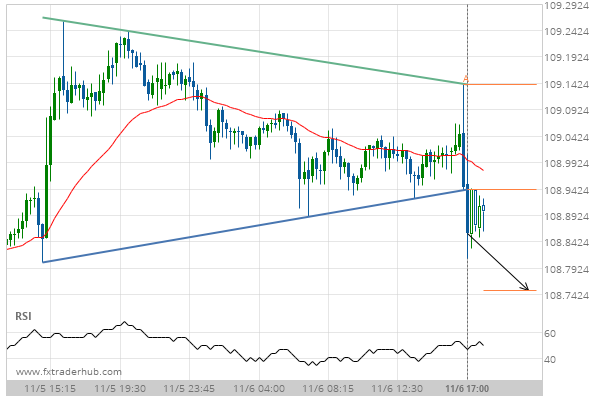
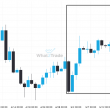
USD/JPY has broken through support of a Triangle. It has touched this line at least twice in the last 2 days.
USD/JPY has broken through the support line of a Triangle. It has touched this line at least twice…