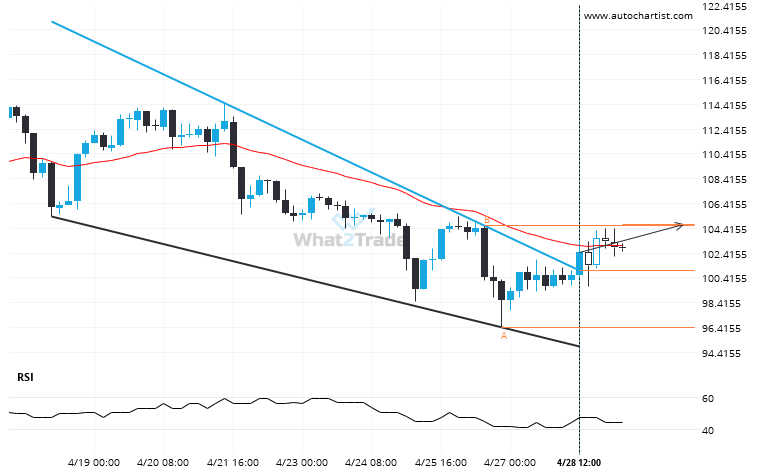
LTCUSD has broken through a resistance line of a Falling Wedge chart pattern. If this breakout holds true, we may see the price of LTCUSD testing 104.7556 within the next 3 days. But don’t be so quick to trade, it has tested this line in the past, so you should confirm the breakout before taking any action.
Related Posts
ETHBTC experienced a very large 20 days bearish move to 0.04515
ETHBTC has experienced an extremely big movement in last 19 days. It may continue the trend, but this…
ADAUSD experienced a very large 18 hours bullish move to 0.4807
ADAUSD has moved higher by 5.49% from 0.4557 to 0.4807 in the last 18 hours.
Big movement possible on BCHUSD after a breach of 459.7300
BCHUSD has broken through a resistance line. It has touched this line numerous times in the last 2…


