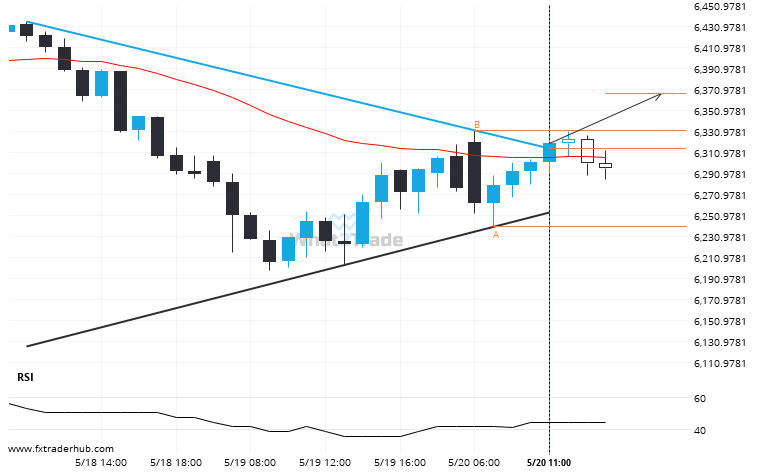
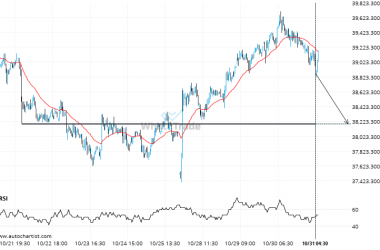
FRA40 has broken through a resistance line of a Triangle chart pattern. If this breakout holds true, we may see the price of FRA40 testing 6366.7813 within the next 5 hours. But don’t be so quick to trade, it has tested this line in the past, so you should confirm the breakout before taking any action.
Related Posts
A possible move on ASX 200 as it heads towards resistance
ASX 200 is heading towards the resistance line of a Channel Down and could reach this point within…
Could a large bearish move on FTSE 100 be a sign of things to come?
Those of you that are trend followers are probably eagerly watching FTSE 100 to see if its latest…
Nikkei 225 likely to test 38187.0000 in the near future. Where to next?
Nikkei 225 is approaching a support line at 38187.0000. If it hits the support line, it may break…

