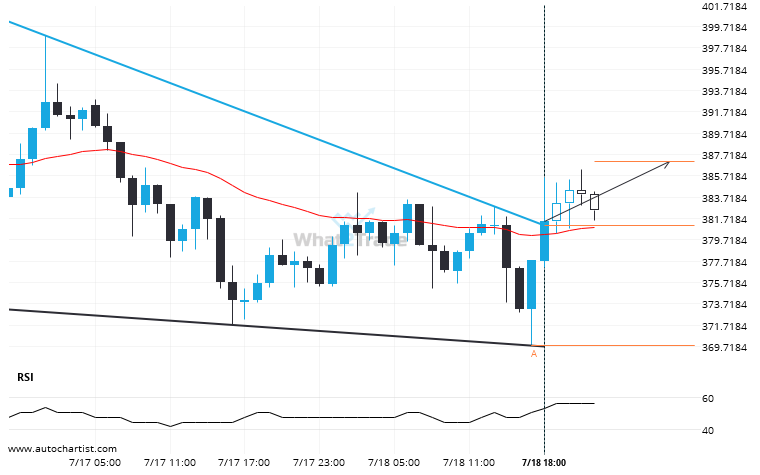
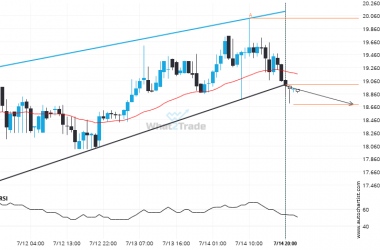
BCHUSD moved through the resistance line of a Falling Wedge at 381.0711111111112 on the 1 hour chart. This line has been tested a number of times in the past and this breakout could mean an upcoming change from the current trend. It may continue in its current direction toward 387.0522.
Related Posts
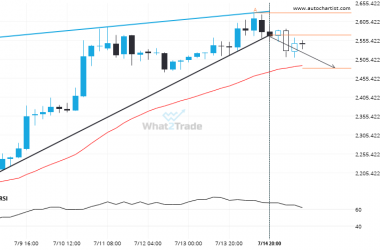
Support line breached by ETHEUR. This price has been tested at least twice before.
ETHEUR has broken through a support line of a Rising Wedge chart pattern. If this breakout holds true,…
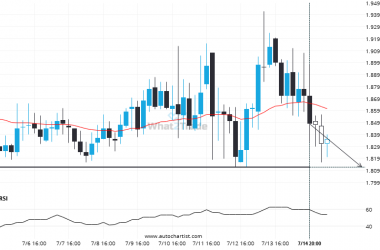
If you’re long DASHBTC you should be aware of the rapidly approaching level of 1.8120E-04
DASHBTC is moving towards a key support level at 1.8120E-04. DASHBTC has previously tested this level 3 times…
Support line breached by DASHEUR. This price has been tested at least twice before.
DASHEUR has broken through a support line. It has touched this line at least twice in the last…

