


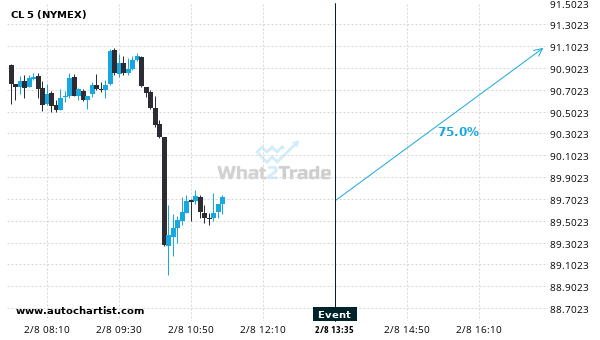
BCHAUD has broken through the support line of a Rising Wedge technical chart pattern. Because we have seen it retrace from this line in the past, one should wait for confirmation of the breakout before taking any action. It has touched this line twice in the last 8 days and suggests a possible target level to be around 464.9755 within the next 3 days.
Related Posts
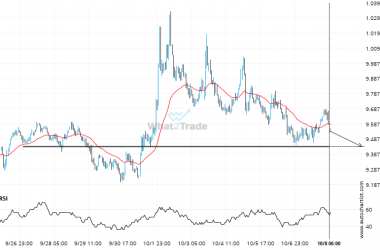
LTCBTC – approaching a price line that has been previously tested numerous times in the past
The price of LTCBTC in heading back to the support area. It is possible that it will struggle…
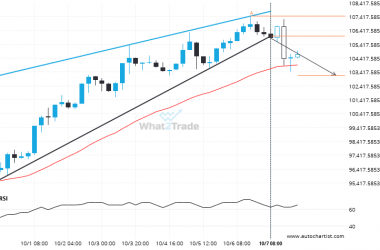
BTCEUR through 106021.44499999998. Is this a confirming a breakout? Will it continue its path in the current trend toward 103177.3167?
Rising Wedge pattern identified on BTCEUR has broken through a support level with the price momentum continuing to…
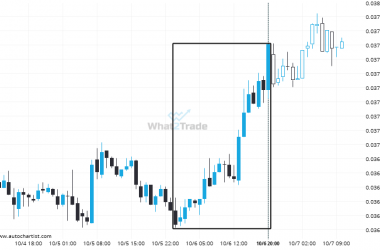
A very large move was recorded on ETHBTC. The size of the shift is exceptional.
ETHBTC has moved higher by 3.48% from 0.03646 to 0.03773 in the last 20 hours.