

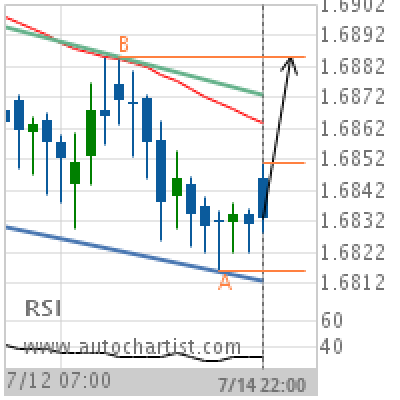
EUR/NZD Target Level: 1.6885
Channel Down identified at 14-Jul-2019 22:00 UTC. This pattern is still in the process of forming. Possible bullish price movement towards the resistance 1.6885 within the next 10 hours. Supported by RSI below 40 Chart 1 hourPattern Channel DownLength 32 CandlesIdentified 14-Jul-2019 22:00 UTC
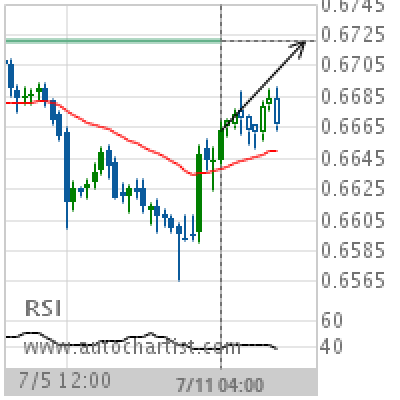
NZD/USD Target Level: 0.6721
Approaching Resistance level of 0.6721 identified at 11-Jul-2019 04:00 UTC Supported by RSI below 40 Chart 4 hourPattern ResistanceLength 54 CandlesIdentified 11-Jul-2019 04:00 UTC
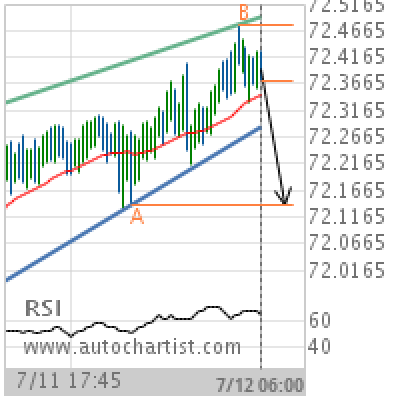
NZD/JPY Target Level: 72.1390
Rising Wedge identified at 12-Jul-2019 06:00 UTC. This pattern is still in the process of forming. Possible bearish price movement towards the support 72.1390 within the next 9 hours. Supported by RSI above 60 Chart 15 MinutesPattern Rising WedgeLength 110 CandlesIdentified 12-Jul-2019 06:00 UTC
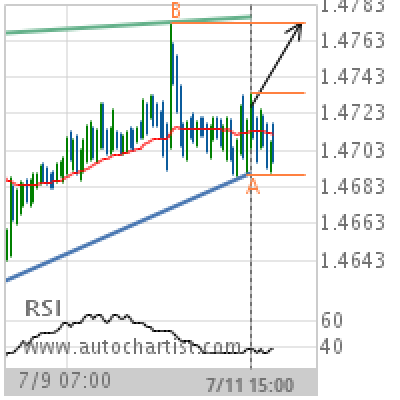
EUR/CAD Target Level: 1.4773
Rising Wedge identified at 11-Jul-2019 15:00 UTC. This pattern is still in the process of forming. Possible bullish price movement towards the resistance 1.4773 within the next day. Supported by RSI below 40 Chart 1 hourPattern Rising WedgeLength 126 CandlesIdentified 11-Jul-2019 15:00 UTC
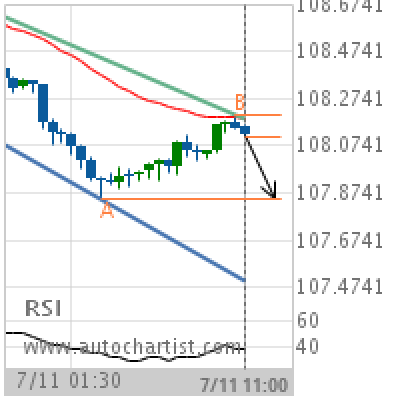
USD/JPY Target Level: 107.8500
Channel Down identified at 11-Jul-2019 11:00 UTC. This pattern is still in the process of forming. Possible bearish price movement towards the support 107.8500 within the next 7 hours. Supported by Downward sloping Moving Average Chart 30 MinutesPattern Channel DownLength 44 CandlesIdentified 11-Jul-2019 11:00 UTC
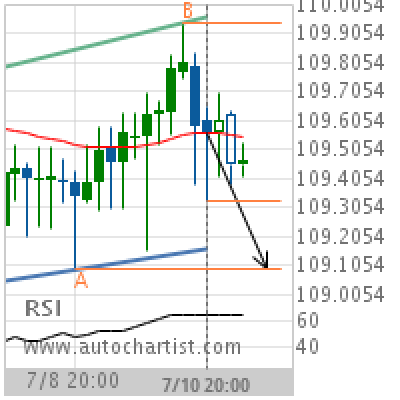
CHF/JPY Target Level: 109.0900
Flag identified at 10-Jul-2019 20:00 UTC. This pattern is still in the process of forming. Possible bearish price movement towards the support 109.0900 within the next day. Supported by RSI above 60 Chart 4 hourPattern FlagLength 30 CandlesIdentified 10-Jul-2019 20:00 UTC
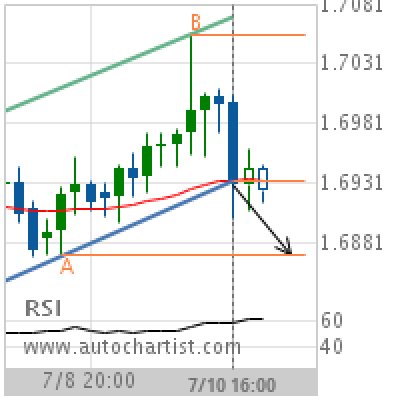
EUR/NZD Target Level: 1.6871
Flag has broken through the support line at 10-Jul-2019 16:00 UTC. Possible bearish price movement forecast for the next day towards 1.6871. Supported by RSI above 60 Chart 4 hourPattern FlagLength 29 CandlesIdentified 10-Jul-2019 16:00 UTC
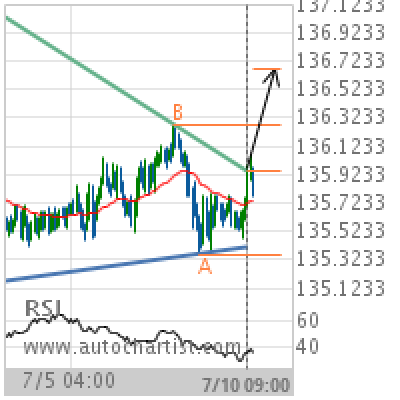
GBP/JPY Target Level: 136.6726
Triangle has broken through the resistance line at 10-Jul-2019 09:00 UTC. Possible bullish price movement forecast for the next 2 days towards 136.6726. Supported by RSI below 40 Chart 1 hourPattern TriangleLength 178 CandlesIdentified 10-Jul-2019 09:00 UTC
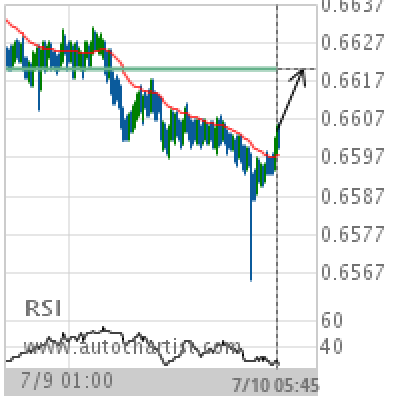
NZD/USD Target Level: 0.6621
Approaching Resistance level of 0.6621 identified at 10-Jul-2019 05:45 UTC Supported by RSI below 40 Chart 15 MinutesPattern ResistanceLength 252 CandlesIdentified 10-Jul-2019 05:45 UTC
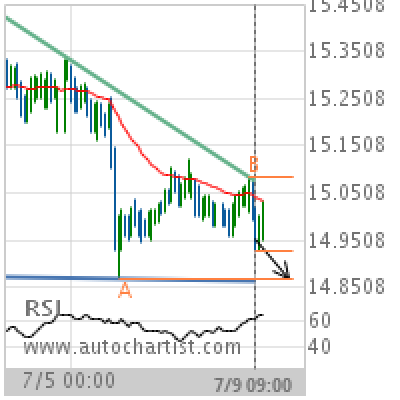
XAG/USD Target Level: 14.8700
Descending Triangle identified at 09-Jul-2019 09:00 UTC. This pattern is still in the process of forming. Possible bearish price movement towards the support 14.8700 within the next 2 days. Supported by RSI above 60 Chart 1 hourPattern Descending TriangleLength 127 CandlesIdentified 09-Jul-2019 09:00 UTC