

XAG/USD Target Level: 15.5300
Channel Up identified at 18-Jul-2019 07:00 UTC. This pattern is still in the process of forming. Possible bearish price movement towards the support 15.5300 within the next 18 hours. Supported by RSI above 60 Chart 1 hourPattern Channel UpLength 69 CandlesIdentified 18-Jul-2019 07:00 UTC
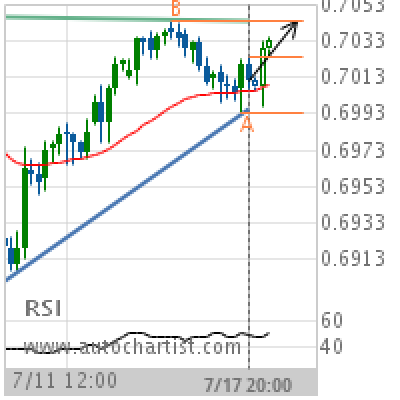
AUD/USD Target Level: 0.7044
Ascending Triangle identified at 17-Jul-2019 20:00 UTC. This pattern is still in the process of forming. Possible bullish price movement towards the resistance 0.7044 within the next 3 days. Supported by Upward sloping Moving Average Chart 4 hourPattern Ascending TriangleLength 60 CandlesIdentified 17-Jul-2019 20:00 UTC
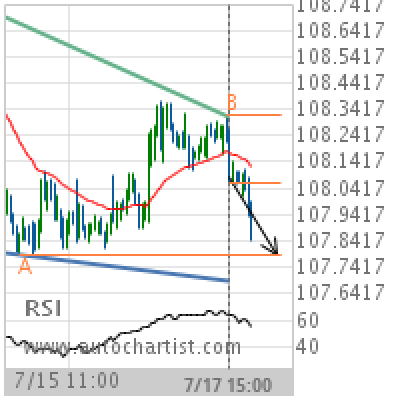
USD/JPY Target Level: 107.7900
Falling Wedge identified at 17-Jul-2019 15:00 UTC. This pattern is still in the process of forming. Possible bearish price movement towards the support 107.7900 within the next day. Supported by Downward sloping Moving Average Chart 1 hourPattern Falling WedgeLength 122 CandlesIdentified 17-Jul-2019 15:00 UTC
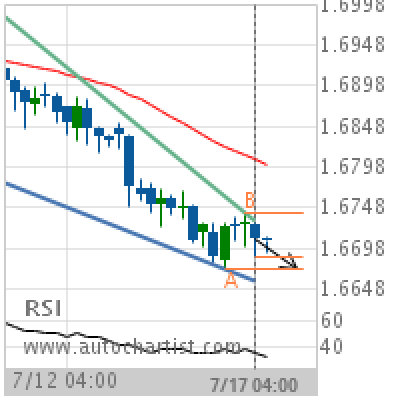
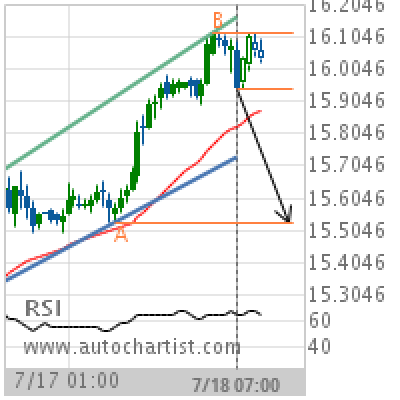
EUR/NZD Target Level: 1.6673
Falling Wedge identified at 17-Jul-2019 04:00 UTC. This pattern is still in the process of forming. Possible bearish price movement towards the support 1.6673 within the next 2 days. Supported by Downward sloping Moving Average Chart 4 hourPattern Falling WedgeLength 42 CandlesIdentified 17-Jul-2019 04:00 UTC
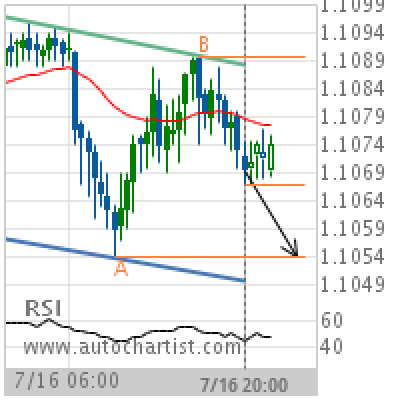
EUR/CHF Target Level: 1.1054
Channel Down identified at 16-Jul-2019 20:00 UTC. This pattern is still in the process of forming. Possible bearish price movement towards the support 1.1054 within the next 9 hours. Supported by Downward sloping Moving Average Chart 30 MinutesPattern Channel DownLength 64 CandlesIdentified 16-Jul-2019 20:00 UTC
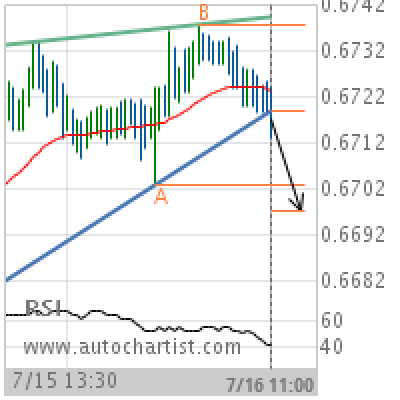
NZD/USD Target Level: 0.6698
Rising Wedge has broken through the support line at 16-Jul-2019 11:00 UTC. Possible bearish price movement forecast for the next 15 hours towards 0.6698. Supported by Downward sloping Moving Average Chart 30 MinutesPattern Rising WedgeLength 93 CandlesIdentified 16-Jul-2019 11:00 UTC
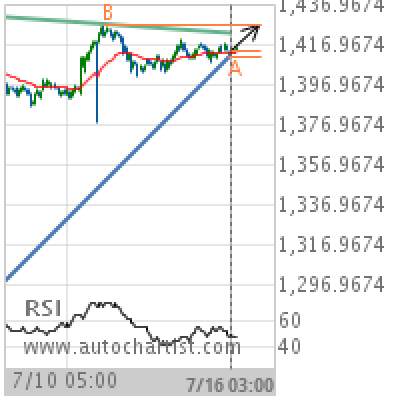
XAU/USD Target Level: 1426.8200
Ascending Triangle identified at 16-Jul-2019 03:00 UTC. This pattern is still in the process of forming. Possible bullish price movement towards the resistance 1426.8200 within the next 3 days. Supported by Upward sloping Moving Average Chart 1 hourPattern Ascending TriangleLength 216 CandlesIdentified 16-Jul-2019 03:00 UTC
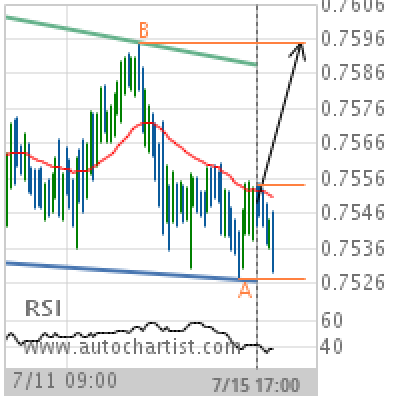
CAD/CHF Target Level: 0.7595
Channel Down identified at 15-Jul-2019 17:00 UTC. This pattern is still in the process of forming. Possible bullish price movement towards the resistance 0.7595 within the next day. Supported by RSI below 40 Chart 1 hourPattern Channel DownLength 123 CandlesIdentified 15-Jul-2019 17:00 UTC
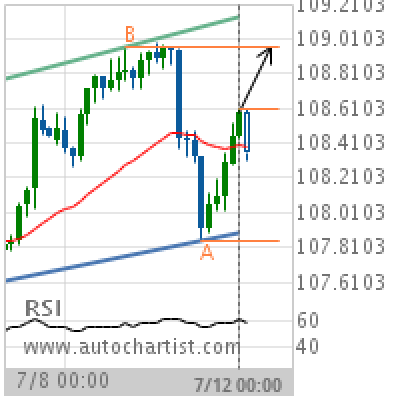
USD/JPY Target Level: 108.9640
Channel Up identified at 12-Jul-2019 00:00 UTC. This pattern is still in the process of forming. Possible bullish price movement towards the resistance 108.9640 within the next 3 days. Supported by Upward sloping Moving Average Chart 4 hourPattern Channel UpLength 53 CandlesIdentified 12-Jul-2019 00:00 UTC
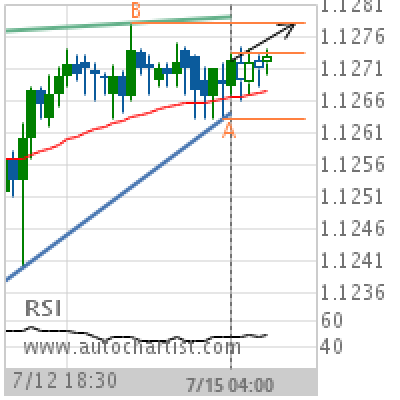
EUR/USD Target Level: 1.1278
Rising Wedge identified at 15-Jul-2019 04:00 UTC. This pattern is still in the process of forming. Possible bullish price movement towards the resistance 1.1278 within the next 5 hours. Supported by Upward sloping Moving Average Chart 30 MinutesPattern Rising WedgeLength 44 CandlesIdentified 15-Jul-2019 04:00 UTC