
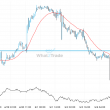

Big Movement GBP/CAD
GBP/CAD experienced a 1.94% bearish movement in the last 6 days. Chart DailyPattern Big MovementLength 5 CandlesIdentified 30-Jul-2019 04:00 UTC
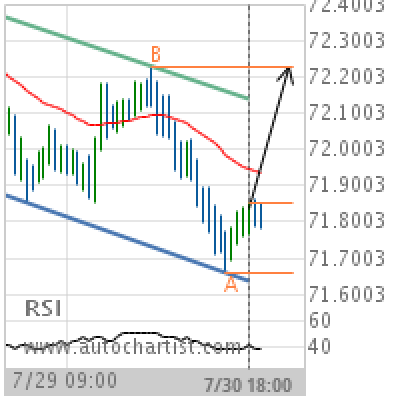
NZD/JPY Target Level: 72.2290
Channel Down identified at 30-Jul-2019 18:00 UTC. This pattern is still in the process of forming. Possible bullish price movement towards the resistance 72.2290 within the next 23 hours. Supported by RSI below 40 Chart 1 hourPattern Channel DownLength 74 CandlesIdentified 30-Jul-2019 18:00 UTC
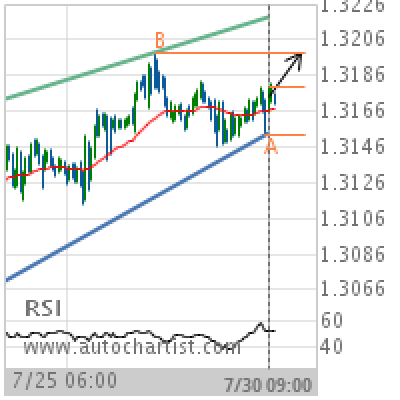
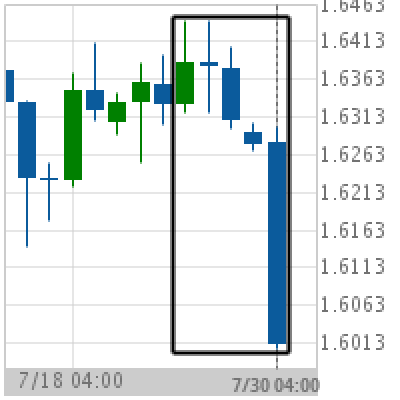
USD/CAD Target Level: 1.3199
Rising Wedge identified at 30-Jul-2019 09:00 UTC. This pattern is still in the process of forming. Possible bullish price movement towards the resistance 1.3199 within the next 2 days. Supported by Upward sloping Moving Average Chart 1 hourPattern Rising WedgeLength 164 CandlesIdentified 30-Jul-2019 09:00 UTC
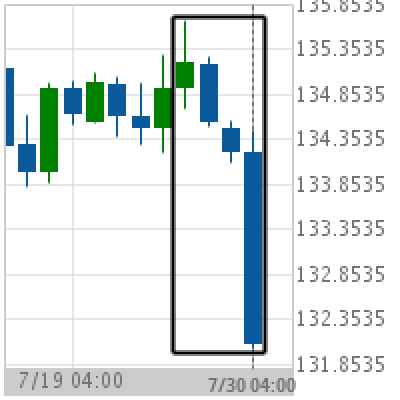
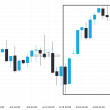
Big Movement GBP/JPY
GBP/JPY experienced a 2.1% bearish movement in the last 5 days. Chart DailyPattern Big MovementLength 4 CandlesIdentified 30-Jul-2019 04:00 UTC
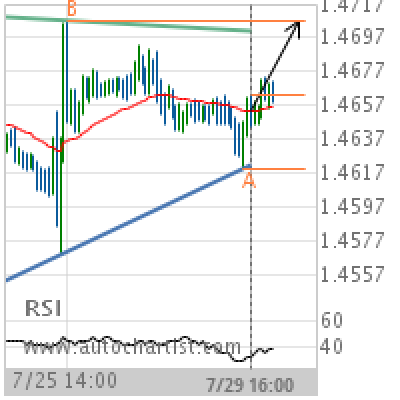
EUR/CAD Target Level: 1.4707
Triangle identified at 29-Jul-2019 16:00 UTC. This pattern is still in the process of forming. Possible bullish price movement towards the resistance 1.4707 within the next day. Supported by RSI below 40 Chart 1 hourPattern TriangleLength 111 CandlesIdentified 29-Jul-2019 16:00 UTC
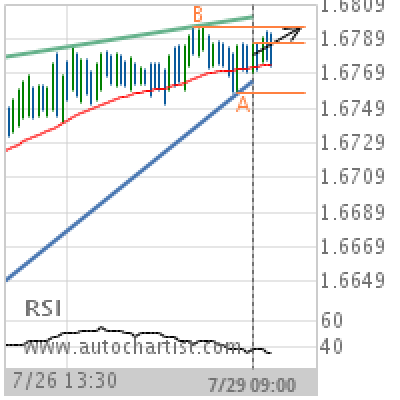
EUR/NZD Target Level: 1.6796
Rising Wedge identified at 29-Jul-2019 09:00 UTC. This pattern is still in the process of forming. Possible bullish price movement towards the resistance 1.6796 within the next 13 hours. Supported by RSI below 40 Chart 30 MinutesPattern Rising WedgeLength 88 CandlesIdentified 29-Jul-2019 09:00 UTC
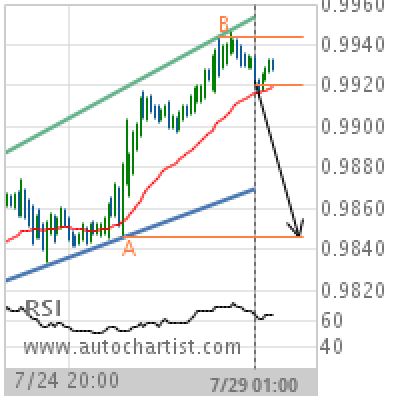
USD/CHF Target Level: 0.9846
Channel Up identified at 29-Jul-2019 01:00 UTC. This pattern is still in the process of forming. Possible bearish price movement towards the support 0.9846 within the next day. Supported by RSI above 60 Chart 1 hourPattern Channel UpLength 119 CandlesIdentified 29-Jul-2019 01:00 UTC
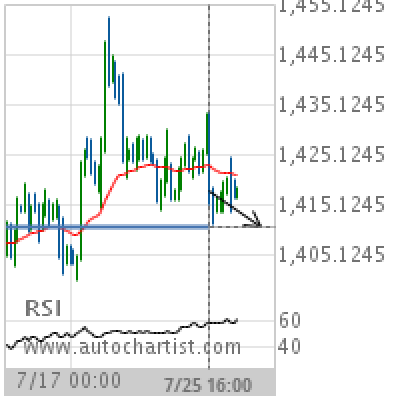
XAU/USD Target Level: 1410.4000
Approaching Support level of 1410.4000 identified at 25-Jul-2019 16:00 UTC Supported by RSI above 60 Chart 4 hourPattern SupportLength 100 CandlesIdentified 25-Jul-2019 16:00 UTC
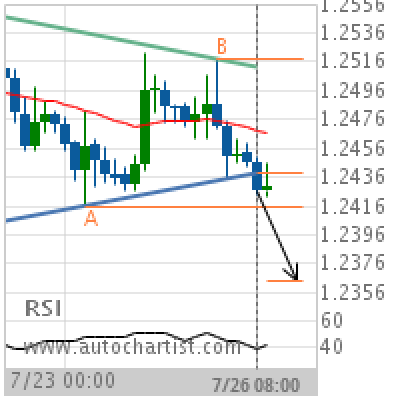
GBP/USD Target Level: 1.2364
Triangle has broken through the support line at 26-Jul-2019 08:00 UTC. Possible bearish price movement forecast for the next 2 days towards 1.2364. Supported by Downward sloping Moving Average Chart 4 hourPattern TriangleLength 43 CandlesIdentified 26-Jul-2019 08:00 UTC
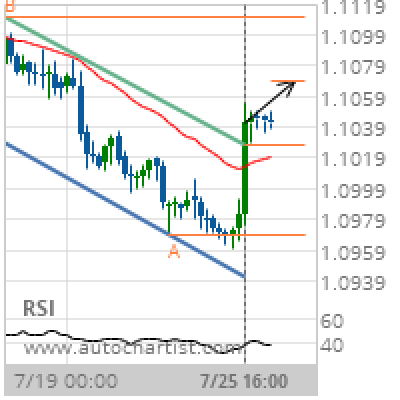
EUR/CHF Target Level: 1.1069
Channel Down has broken through the resistance line at 25-Jul-2019 16:00 UTC. Possible bullish price movement forecast for the next 2 days towards 1.1069. Supported by RSI below 40 Chart 4 hourPattern Channel DownLength 58 CandlesIdentified 25-Jul-2019 16:00 UTC