

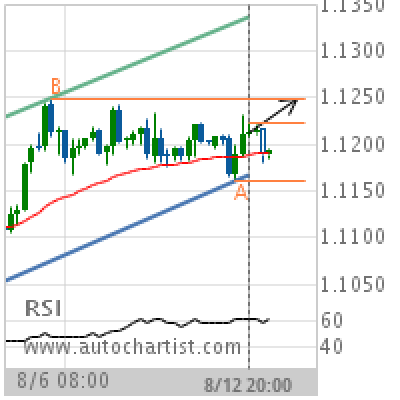
EUR/USD Target Level: 1.1250
Channel Up identified at 12-Aug-2019 20:00 UTC. This pattern is still in the process of forming. Possible bullish price movement towards the resistance 1.1250 within the next 3 days. Supported by Upward sloping Moving Average Chart 4 hourPattern Channel UpLength 62 CandlesIdentified 12-Aug-2019 20:00 UTC
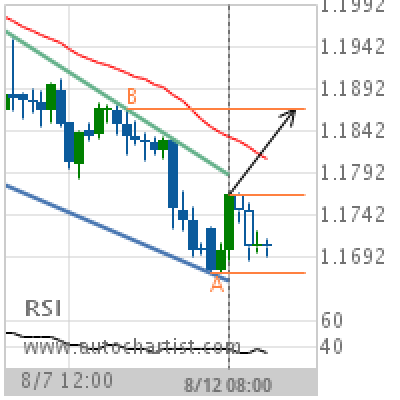
GBP/CHF Target Level: 1.1867
Channel Down identified at 12-Aug-2019 08:00 UTC. This pattern is still in the process of forming. Possible bullish price movement towards the resistance 1.1867 within the next 2 days. Supported by RSI below 40 Chart 4 hourPattern Channel DownLength 42 CandlesIdentified 12-Aug-2019 08:00 UTC
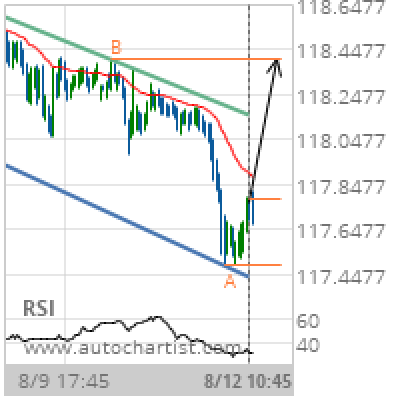
EUR/JPY Target Level: 118.4000
Channel Down identified at 12-Aug-2019 10:45 UTC. This pattern is still in the process of forming. Possible bullish price movement towards the resistance 118.4000 within the next 12 hours. Supported by RSI below 40 Chart 15 MinutesPattern Channel DownLength 150 CandlesIdentified 12-Aug-2019 10:45 UTC
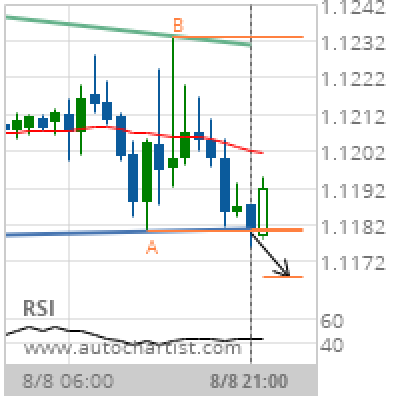
EUR/USD Target Level: 1.1168
Descending Triangle has broken through the support line at 08-Aug-2019 21:00 UTC. Possible bearish price movement forecast for the next 10 hours towards 1.1168. Supported by Downward sloping Moving Average Chart 1 hourPattern Descending TriangleLength 34 CandlesIdentified 08-Aug-2019 21:00 UTC
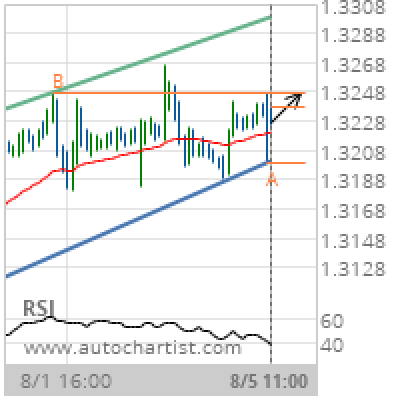
USD/CAD Target Level: 1.3247
Channel Up identified at 05-Aug-2019 11:00 UTC. This pattern is still in the process of forming. Possible bullish price movement towards the resistance 1.3247 within the next day. Supported by RSI below 40 Chart 1 hourPattern Channel UpLength 93 CandlesIdentified 05-Aug-2019 11:00 UTC
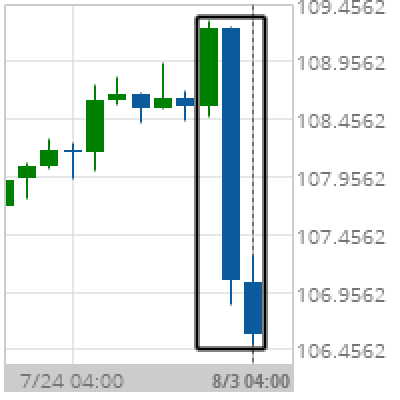
Big Movement USD/JPY
USD/JPY experienced a 1.82% bearish movement in the last 3 days. Chart DailyPattern Big MovementLength 3 CandlesIdentified 03-Aug-2019 04:00 UTC
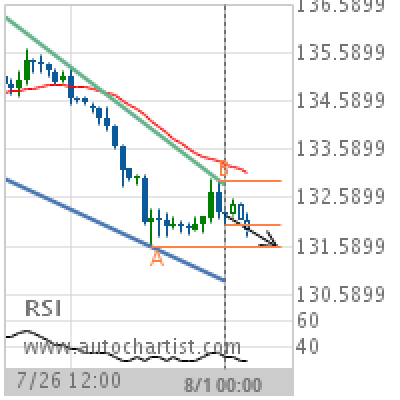
GBP/JPY Target Level: 131.5800
Falling Wedge identified at 01-Aug-2019 00:00 UTC. This pattern is still in the process of forming. Possible bearish price movement towards the support 131.5800 within the next 2 days. Supported by Downward sloping Moving Average Chart 4 hourPattern Falling WedgeLength 52 CandlesIdentified 01-Aug-2019 00:00 UTC
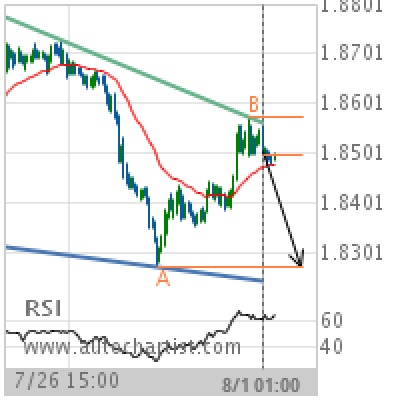
GBP/NZD Target Level: 1.8274
Falling Wedge identified at 01-Aug-2019 01:00 UTC. This pattern is still in the process of forming. Possible bearish price movement towards the support 1.8274 within the next 2 days. Supported by RSI above 60 Chart 1 hourPattern Falling WedgeLength 181 CandlesIdentified 01-Aug-2019 01:00 UTC
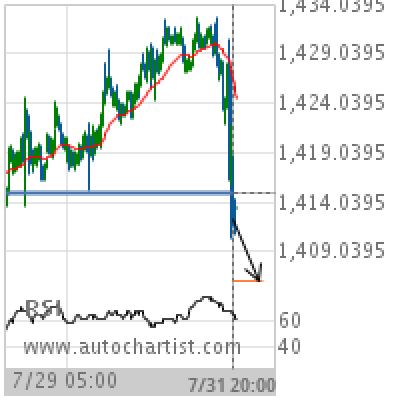
XAU/USD Target Level: 1406.1200
Broke through Support level of 1414.9000 at 31-Jul-2019 20:00 UTC Supported by RSI above 60 Chart 30 MinutesPattern SupportLength 284 CandlesIdentified 31-Jul-2019 20:00 UTC
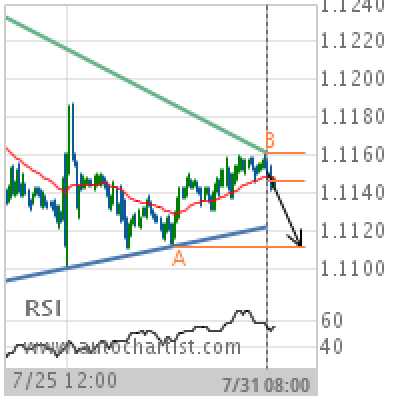
EUR/USD Target Level: 1.1112
Triangle identified at 31-Jul-2019 08:00 UTC. This pattern is still in the process of forming. Possible bearish price movement towards the support 1.1112 within the next 3 days. Supported by Downward sloping Moving Average Chart 1 hourPattern TriangleLength 201 CandlesIdentified 31-Jul-2019 08:00 UTC