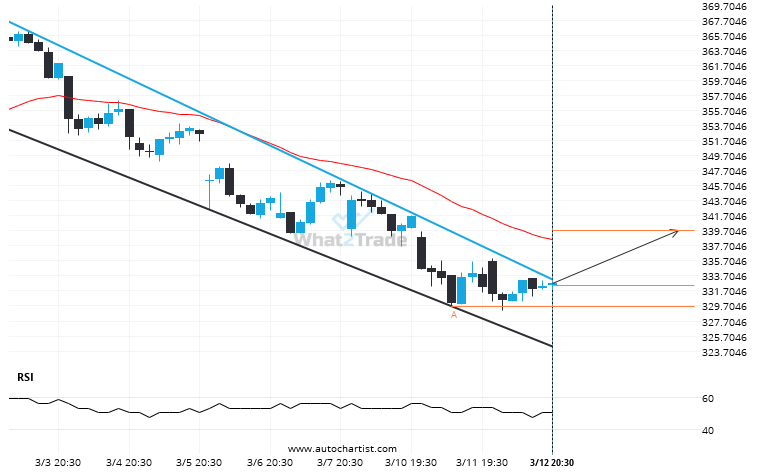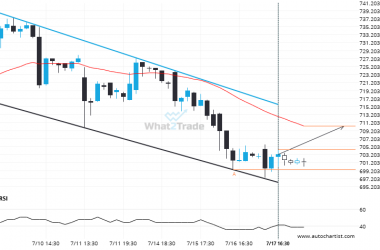
V has broken through a resistance line of a Channel Down and suggests a possible movement to 339.7986 within the next 16 hours. It has tested this line in the past, so one should probably wait for a confirmation of this breakout before taking action. If the breakout doesn’t confirm, we could see a retracement back to lines seen in the last 16 days.
After testing resistance twice in the past, V has finally broken through. Can we expect a bullish trend to follow?