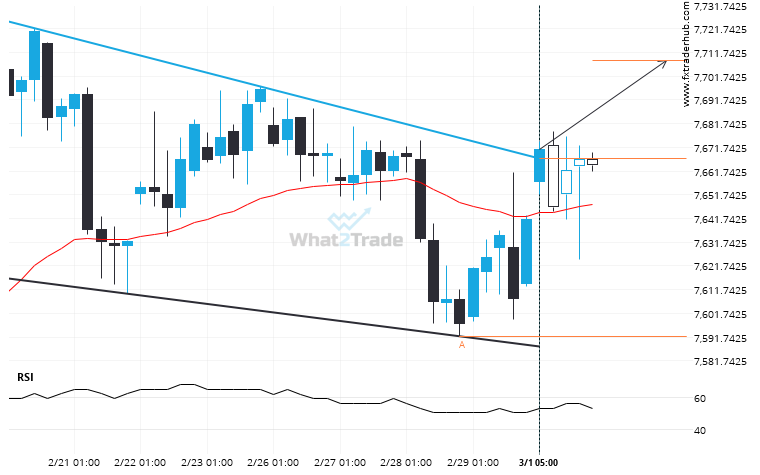
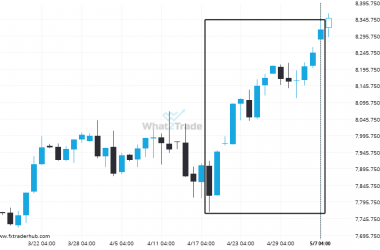
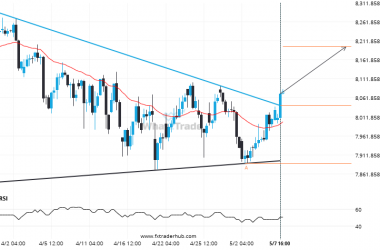
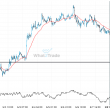
UK100 has broken through a resistance line of a Channel Down and suggests a possible movement to 7708.5388 within the next 2 days. It has tested this line in the past, so one should probably wait for a confirmation of this breakout before taking action. If the breakout doesn’t confirm, we could see a retracement back to lines seen in the last 17 days.
Related Posts
Bulls aim for 8206.1736 after the FRA40 triggered a bullish formation on the Daily chart
Triangle pattern identified on FRA40 has broken through a resistance level with the price momentum continuing to move…
Extreme movement experienced on UK100. Check this chart to see what to do next
A movement of 6.41% over 20 days on UK100 doesn’t go unnoticed. You may start considering where it’s…
Bulls aim for 8197.1608 after the FRA40 triggered a bullish formation on the 4 hour chart
FRA40 has broken through a resistance line of a Triangle chart pattern. If this breakout holds true, we…