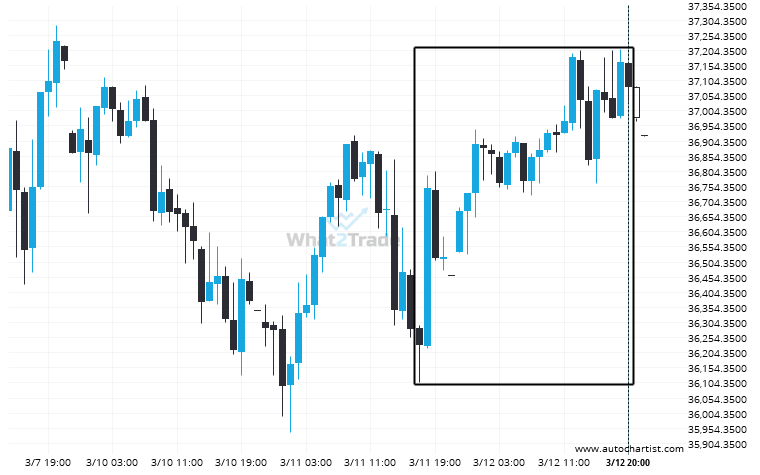
An unexpected large move has occurred on Nikkei 225 1 hour chart beginning at 36229.0 and ending at 37080.0. Is this a sign of something new? What can we expect in the future?
Related Posts
DOW 30 experienced a very large 27 days bearish move to 41535.9
DOW 30 has moved lower by 6.77% from 44551.98 to 41535.9 in the last 27 days.
If DOW 30 touches 41586.8711 it may be time to take action.
DOW 30 is moving towards a resistance line. Because we have seen it retrace from this level in…
A possible move on FTSE 100 as it heads towards resistance
An emerging Flag has been detected on FTSE 100 on the 4 hour chart. There is a possible…