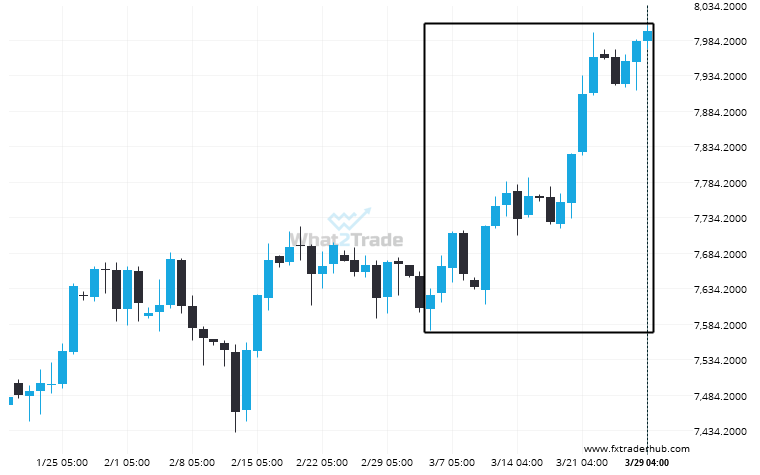
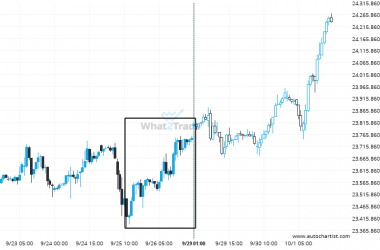
UK100 rose sharply for 24 days – which is an excessively big movement for this instrument; exceeding the 98% of past price moves. Even if this move is a sign of a new trend in UK100 there is a chance that we will witness a correction, no matter how brief.
Related Posts
Extreme movement experienced on UK100. Check this chart to see what to do next
A movement of 6.41% over 20 days on UK100 doesn’t go unnoticed. You may start considering where it’s…
Bulls aim for 8197.1608 after the FRA40 triggered a bullish formation on the 4 hour chart
FRA40 has broken through a resistance line of a Triangle chart pattern. If this breakout holds true, we…
AUS200 hits 7763.0 after a 1.74% move spanning 4 days
AUS200 hits 7763.0 after a 1.74% move spanning 4 days.