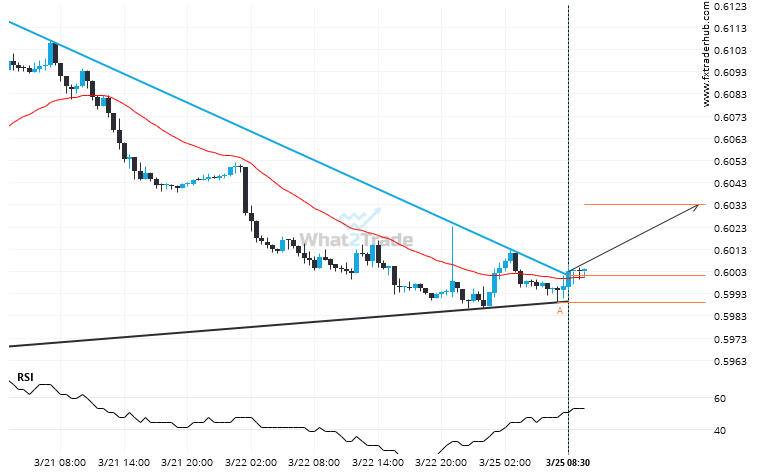
NZD/USD moved through the resistance line of a Triangle at 0.6001140229885056 on the 30 Minutes chart. This line has been tested a number of times in the past and this breakout could mean an upcoming change from the current trend. It may continue in its current direction toward 0.6033.
Related Posts
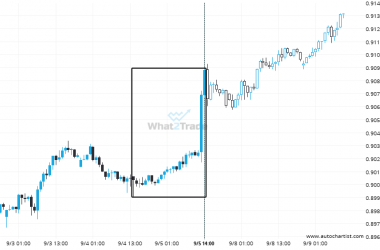
A very large move was recorded on AUDCAD. The size of the shift is exceptional.
AUDCAD reached 0.909115 after a 0.94% move spanning 2 days.
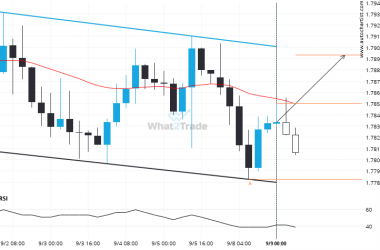
EURAUD is quickly approaching the resistance line of a Channel Down. We expect either a breakout through this line or a rebound.
EURAUD is trapped in a Channel Down formation, implying that a breakout is Imminent. This is a great…
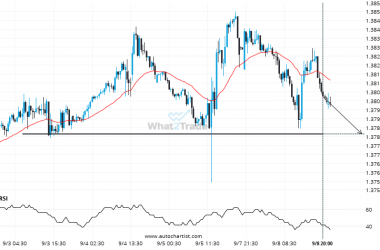
Supports and resistances are primary concepts of technical analysis. USDCAD is heading for an important price of 1.3786 – read about what this could mean for the future.
USDCAD is moving towards a line of 1.3786 which it has tested numerous times in the past. We…

