
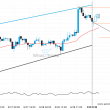
USD/JPY has broken through the resistance line of a Triangle technical chart pattern. Because we have seen it retrace from this line in the past, one should wait for confirmation of the breakout before taking any action. It has touched this line twice in the last 11 days and suggests a possible target level to be around 115.7435 within the next 2 days.
Related Posts
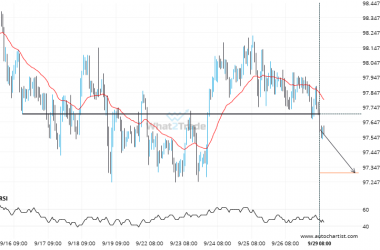
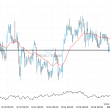
Big movement possible on AUDJPY after a breach of 97.7030
AUDJPY has broken through 97.7030 which it has tested numerous times in the past. We have seen it…
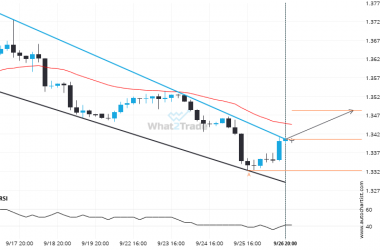
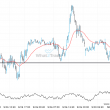
Interesting opportunity on GBPUSD after breaking 1.3407553703703703
This trade setup on GBPUSD is formed by a period of consolidation; a period in which the price…
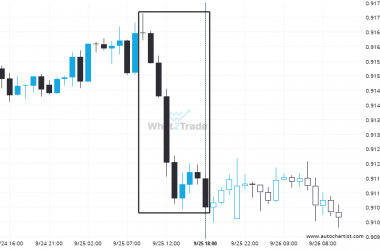
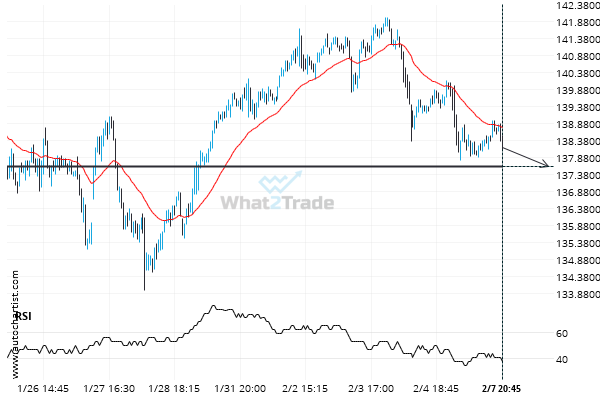
AUDCAD experienced a very large 9 hours bearish move to 0.91067.
AUDCAD has moved lower by 0.65% from 0.91662 to 0.91067 in the last 9 hours.