

Day: October 28, 2019
17 posts
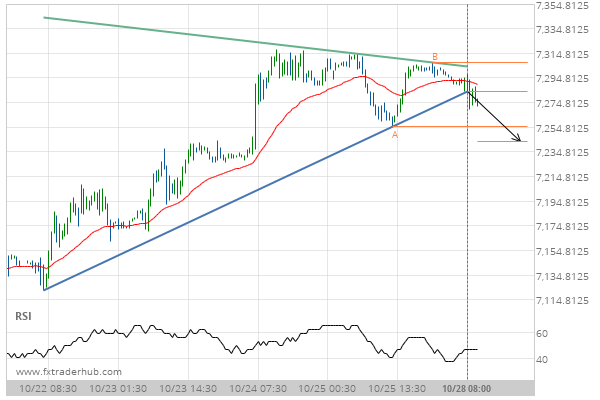
Breach of support could mean a start of a bearish trend on UK100
UK100 has broken through a support line of a Triangle chart pattern. If this breakout holds true, we…
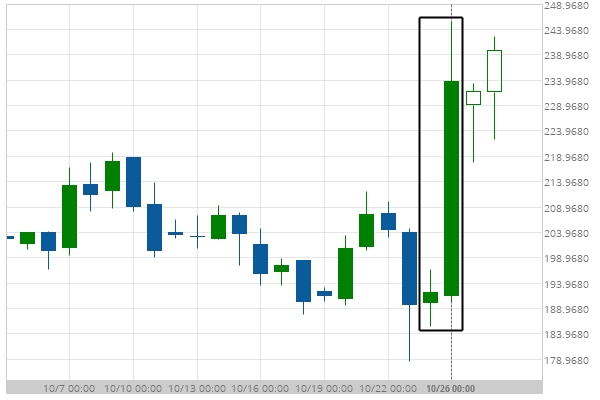
After experiencing a 23.71% bullish move in the space of 3 days, nobody knows where BCHEUR is headed.
Those of you that are trend followers are probably eagerly watching BCHEUR to see if its latest 23.71%…
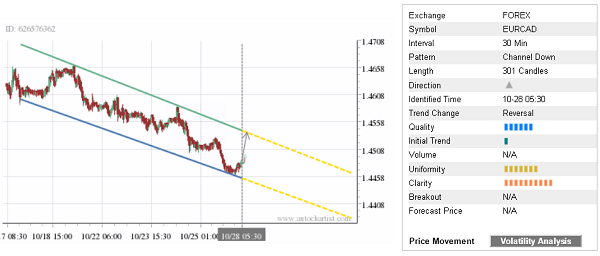
Trade of the Day: EUR/CAD
By: Dima Chernovolov EUR/CAD continues to rise inside the 30-minute Down Channel chart pattern which was identified previously by Autochartist. Autochartist rates the quality of this Down Channel at the 6-bar level – which is the result of the slow Initial Trend (1 bar), above-average Uniformity (6 bars) and maximum Clarity (10 bars). EUR/CAD is…
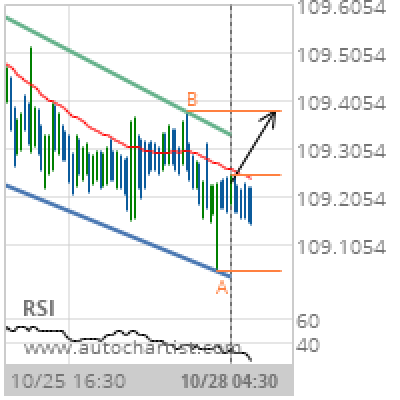
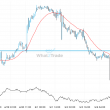
CHF/JPY Target Level: 109.3816
Channel Down identified at 28-Oct-2019 04:30 UTC. This pattern is still in the process of forming. Possible bullish price movement towards the resistance 109.3816 within the next 8 hours. Supported by RSI below 40 Chart 15 MinutesPattern Channel DownLength 112 CandlesIdentified 28-Oct-2019 04:30 UTC
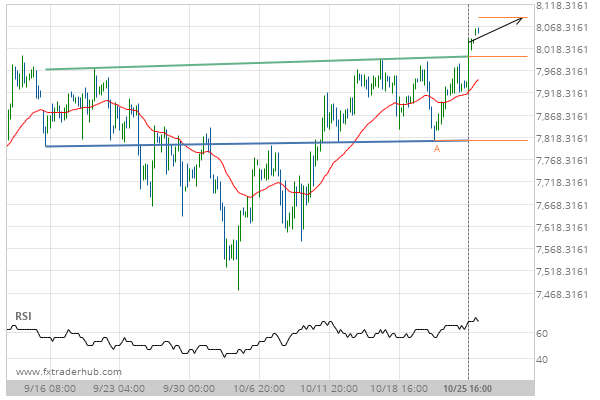
Breach of resistance could mean a start of a bullish trend on NAS100
NAS100 has broken through a resistance line of a Inverse Head and Shoulders chart pattern. If this breakout…
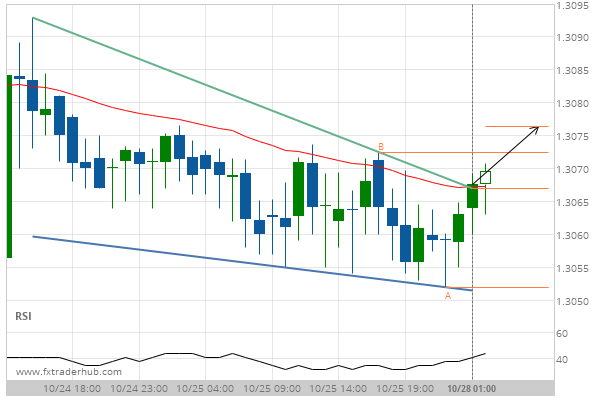
Breach of resistance could mean a start of a bullish trend on USD/CAD
USD/CAD has broken through a resistance line of a Falling Wedge chart pattern. If this breakout holds true,…
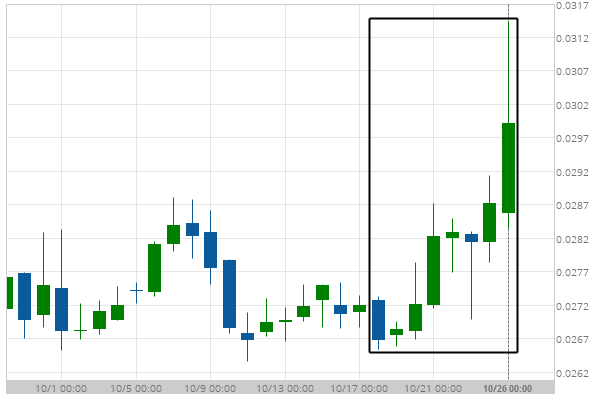
Could a large bullish move on BCHBTC be a sign of things to come?
BCHBTC has experienced an exceptionally large movement higher by 9.67% from 0.027 to 0.03 in the last 9…