
Day: October 11, 2019
24 posts
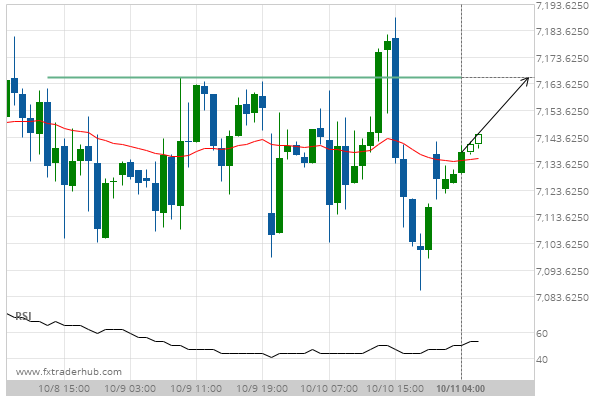
UK100 is quickly approaching 7166.0000. We expect either a breakout through this line, or a rebound.
UK100 is heading towards a line of 7166.0000. If this movement continues, we expect the price of UK100…
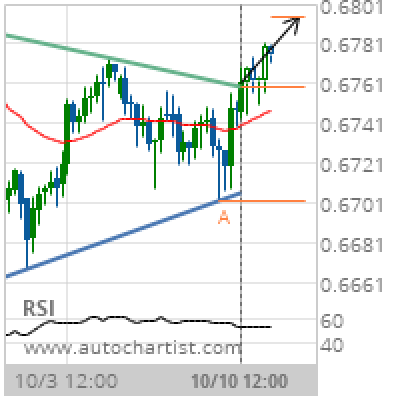
AUD/USD Target Level: 0.6795
Triangle has broken through the resistance line at 10-Oct-2019 12:00 UTC. Possible bullish price movement forecast for the next 3 days towards 0.6795. Supported by Upward sloping Moving Average Chart 4 hourPattern TriangleLength 70 CandlesIdentified 10-Oct-2019 12:00 UTC
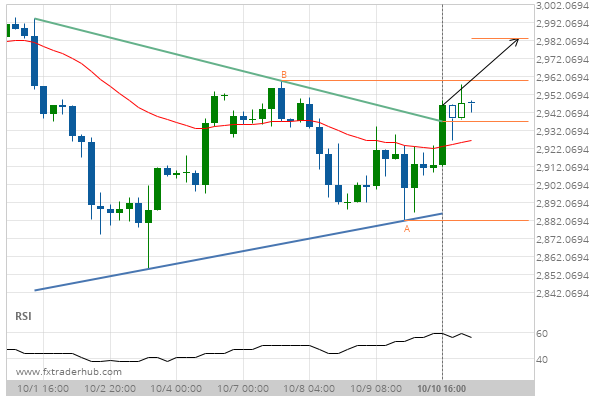
Breach of resistance could mean a start of a bullish trend on SPX500
SPX500 has broken through a resistance line of a Triangle chart pattern. If this breakout holds true, we…
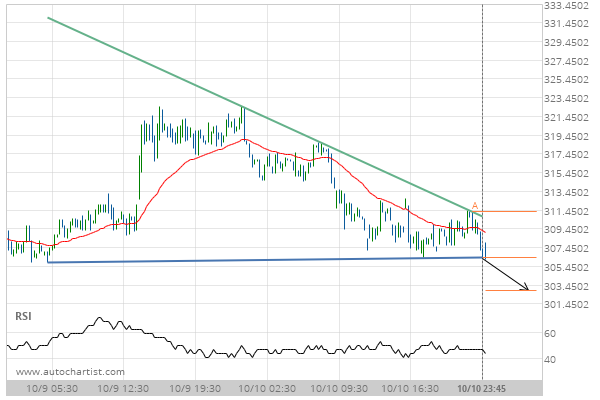
Breach of support could mean a start of a bearish trend on BCHCAD
BCHCAD has broken through a support line of a Descending Triangle chart pattern. If this breakout holds true,…