
Day: October 9, 2019
18 posts
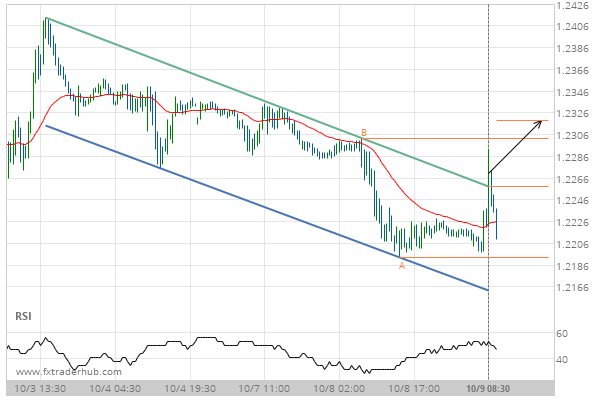
After testing resistance twice in the past, GBP/USD has finally broken through. Can we expect a bullish trend to follow?
The breakout of GBP/USD through the resistance line of a Channel Down could be a sign of the…
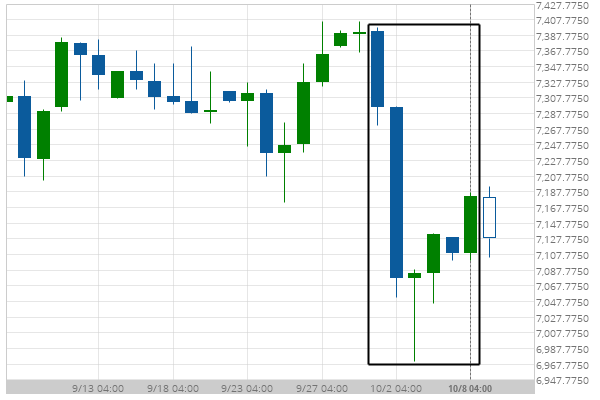
Could a large bearish move on UK100 be a sign of things to come?
UK100 has experienced an exceptionally large movement lower by 2.85% from 7,392.5 to 7,181.5 in the last 8…
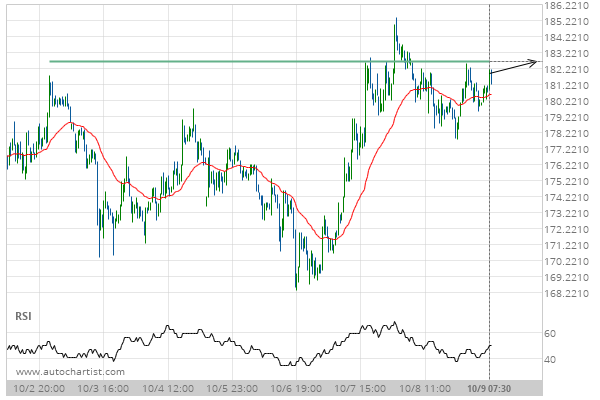
A final push expected on ETHUSD as it starts approaching a price line of 182.6200.
ETHUSD is heading towards a price line of 182.6200 and could reach this point within the next 2…
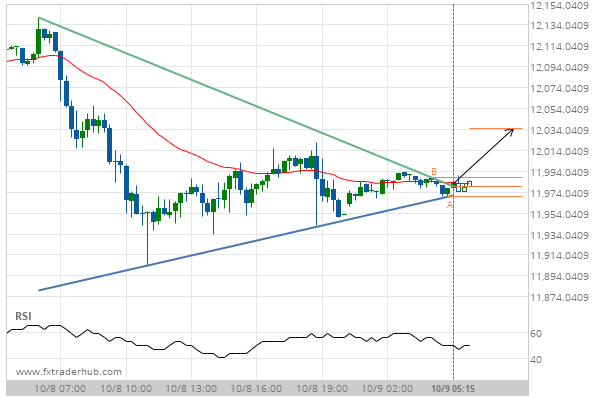
Breach of resistance could mean a start of a bullish trend on GER30
GER30 has broken through a resistance line of a Triangle chart pattern. If this breakout holds true, we…
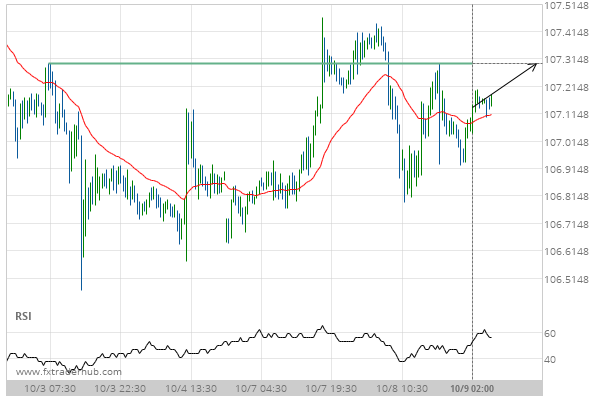
USD/JPY is quickly approaching 107.2970. We expect either a breakout through this line, or a rebound.
USD/JPY is heading towards a line of 107.2970. If this movement continues, we expect the price of USD/JPY…
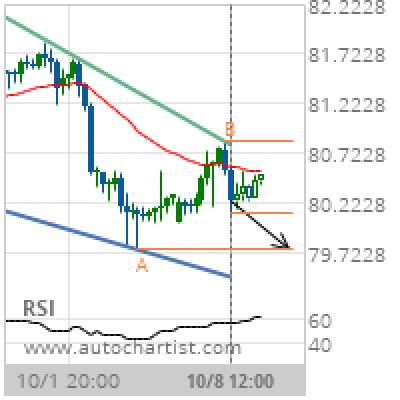
CAD/JPY Target Level: 79.7500
Falling Wedge identified at 08-Oct-2019 12:00 UTC. This pattern is still in the process of forming. Possible bearish price movement towards the support 79.7500 within the next 3 days. Supported by RSI above 60 Chart 4 hourPattern Falling WedgeLength 68 CandlesIdentified 08-Oct-2019 12:00 UTC
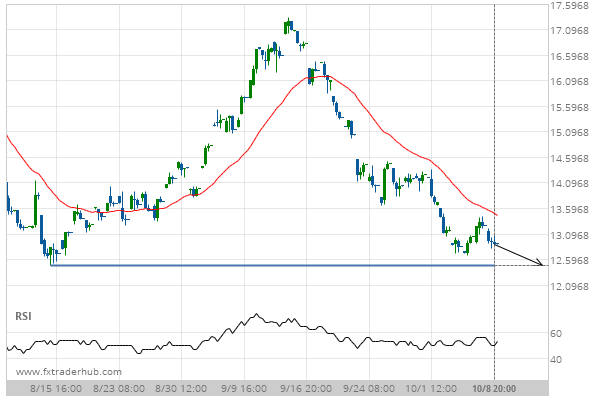
FRA40 is quickly approaching 12.4800. We expect either a breakout through this line, or a rebound.
FRA40 is heading towards a line of 12.4800. If this movement continues, we expect the price of FRA40…
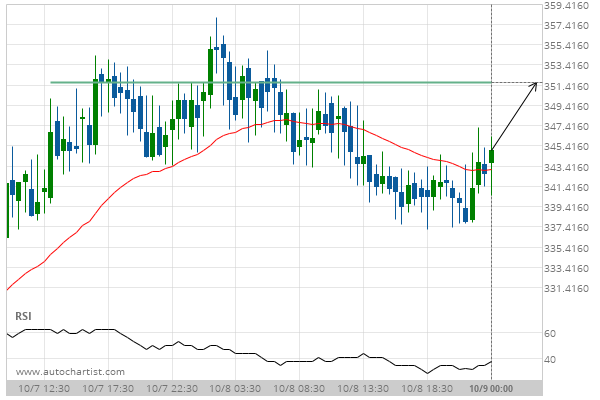
A final push expected on BCHAUD as it starts approaching a price line of 351.6500.
BCHAUD is heading towards a price line of 351.6500 and could reach this point within the next 8…