
Day: September 25, 2019
36 posts
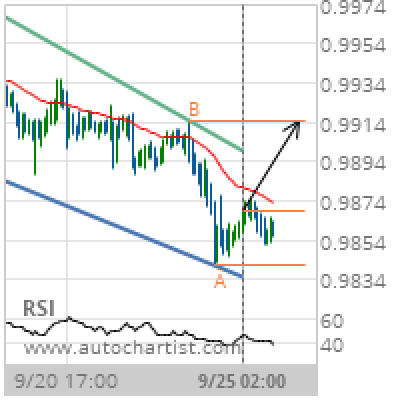
USD/CHF Target Level: 0.9914
Channel Down identified at 25-Sep-2019 02:00 UTC. This pattern is still in the process of forming. Possible bullish price movement towards the resistance 0.9914 within the next day. Supported by RSI below 40 Chart 1 hourPattern Channel DownLength 129 CandlesIdentified 25-Sep-2019 02:00 UTC
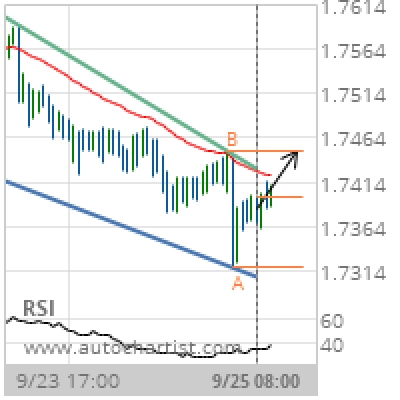
EUR/NZD Target Level: 1.7449
Falling Wedge identified at 25-Sep-2019 08:00 UTC. This pattern is still in the process of forming. Possible bullish price movement towards the resistance 1.7449 within the next day. Supported by RSI below 40 Chart 1 hourPattern Falling WedgeLength 87 CandlesIdentified 25-Sep-2019 08:00 UTC
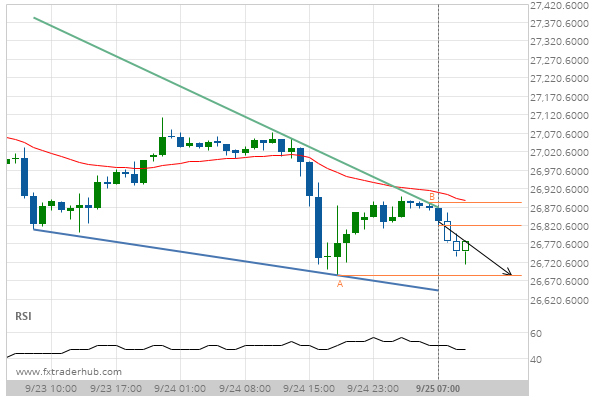
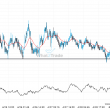
US30 – approaching a support line that has been previously tested at least twice in the past
US30 is moving towards the support line of a Falling Wedge. Because we have seen it retrace from…
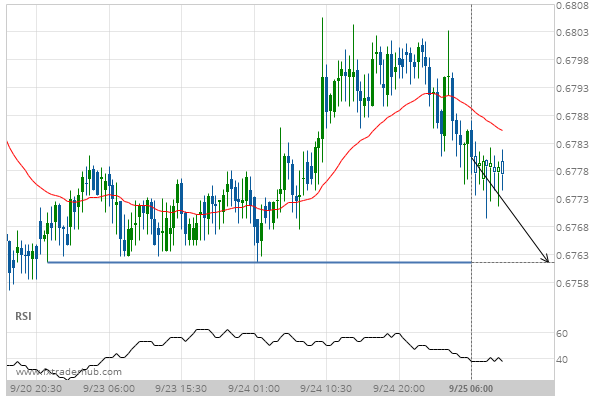
After testing 0.6762 numerous times, AUD/USD is once again approaching this price point. Can we expect a bearish trend to follow?
The movement of AUD/USD towards 0.6762 price line is yet another test of the line it reached numerous…
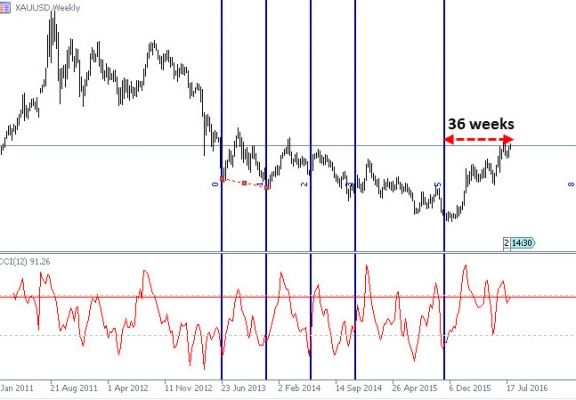
Trading with the Commodity Channel Index
When trading, one of the most important pieces of information to have is the ability to identify momentum—when it begins and when it ends. It can help you plan your next trade and to ensure that that trade is successful. It is in the process of charting momentum that the Commodity Channel Index is especially…
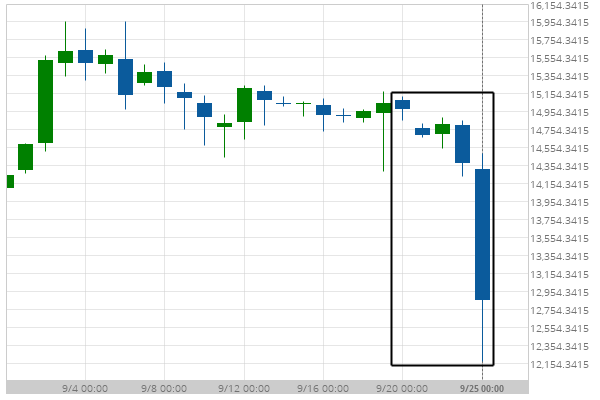
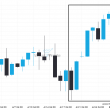
BTCAUD hits 12,860.88 after a 14.7% move spanning 6 days
For those of you that don’t believe in trends, this may be an opportunity to take advantage of…
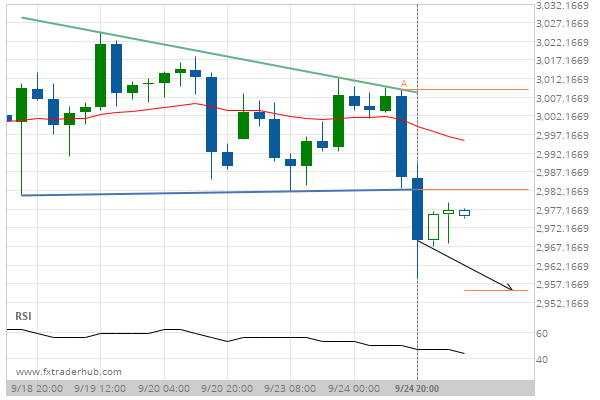
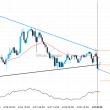
Breach of support could mean a start of a bearish trend on SPX500
SPX500 has broken through a support line of a Descending Triangle chart pattern. If this breakout holds true,…
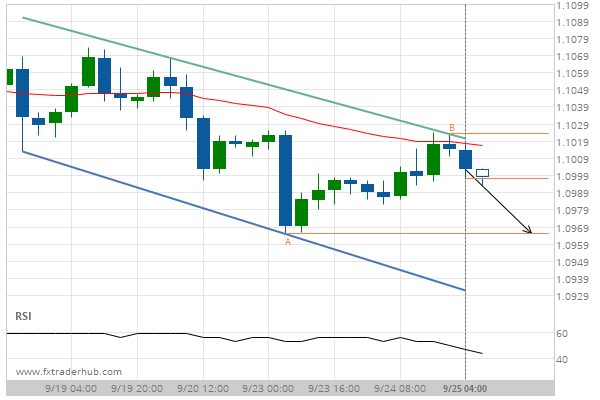
Important support line being approached by EUR/USD. This price has been tested numerous time in the last 7 days
EUR/USD is moving towards the support line of a Channel Down which it has tested numerous times in…
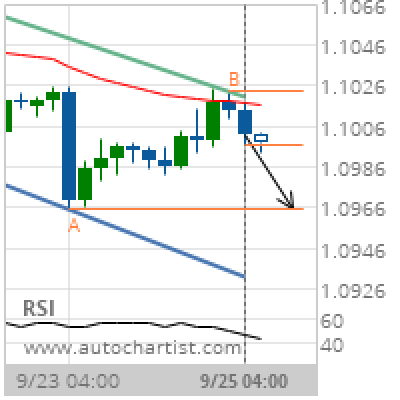
EUR/USD Target Level: 1.0965
Channel Down identified at 25-Sep-2019 04:00 UTC. This pattern is still in the process of forming. Possible bearish price movement towards the support 1.0965 within the next day. Supported by Downward sloping Moving Average Chart 4 hourPattern Channel DownLength 27 CandlesIdentified 25-Sep-2019 04:00 UTC
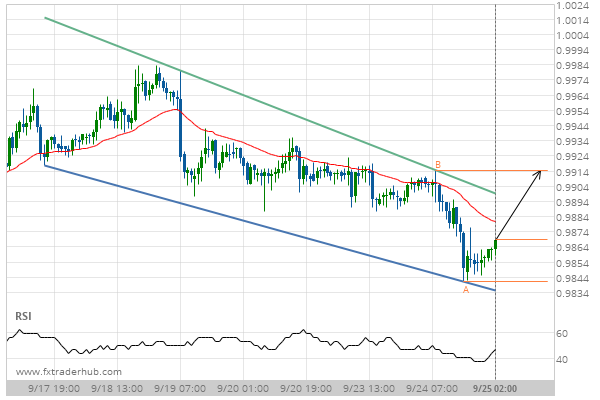
USD/CHF – approaching a resistance line that has been previously tested at least twice in the past
USD/CHF is moving towards the resistance line of a Channel Down. Because we have seen it retrace from…