
Day: September 9, 2019
36 posts
BTCJPY – breach of a trending resistance line that has been tested at least twice before.
BTCJPY has broken through the resistance line of a Falling Wedge technical chart pattern. Because we have seen…
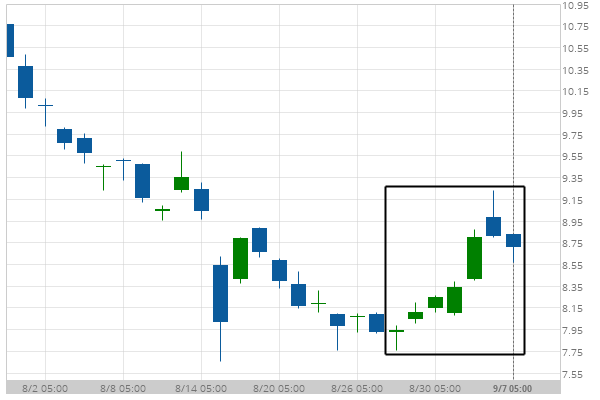
General Electric Co. moves higher to 8.7 in the last 11 days.
A movement of 9.85% over 11 days on General Electric Co. doesn’t go unnoticed. You may start considering…
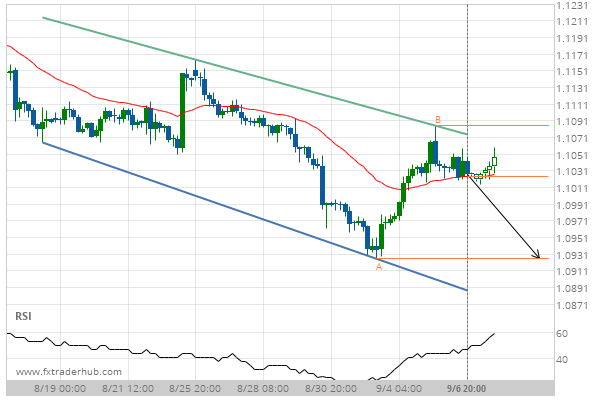
A quick move expected on EUR/USD as it starts approaching a support line of a Channel Down
EUR/USD is heading towards the support line of a Channel Down and could reach this point within the…
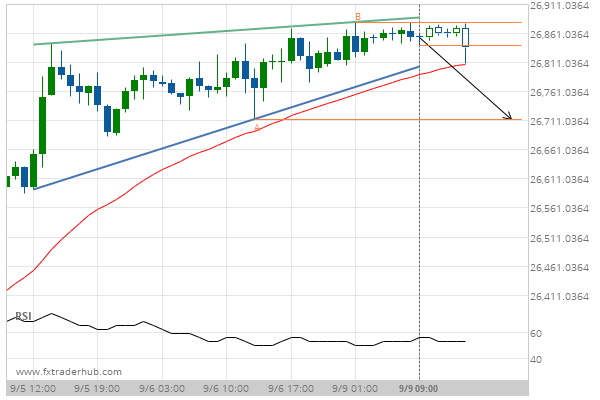
US30 is quickly approaching the support line of a Rising Wedge. We expect either a breakout through this line or a rebound.
US30 is heading towards the support line of a Rising Wedge. If this movement continues, we expect the…
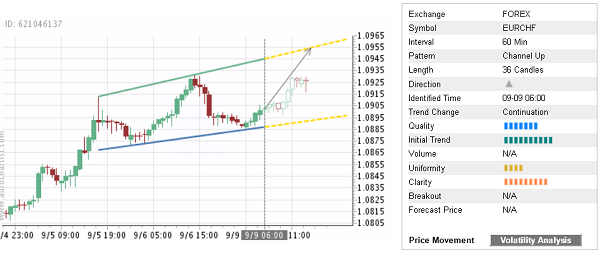
Trade of the Day: EUR/CHF
By: Dima Chernovolov EUR/CHF continues to rise inside the hourly Up Chanel chart pattern which was identified previously by Autochartist. Autochartist rates the quality of this Up Chanel at the 7-bar level – which reflects the sharp Initial Trend (10 bars), below-average Uniformity (4 bars) and strong Clarity (9 bars). EUR/CHF is expected to rise…
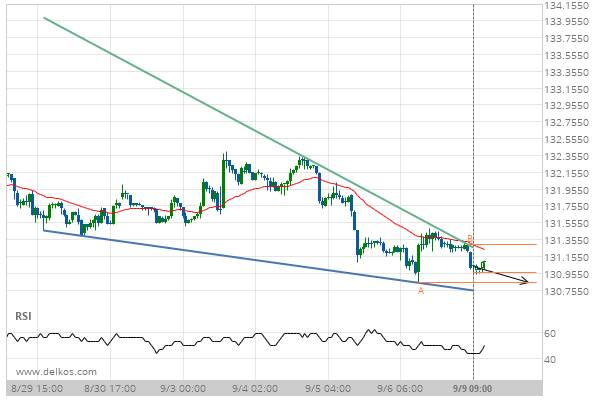
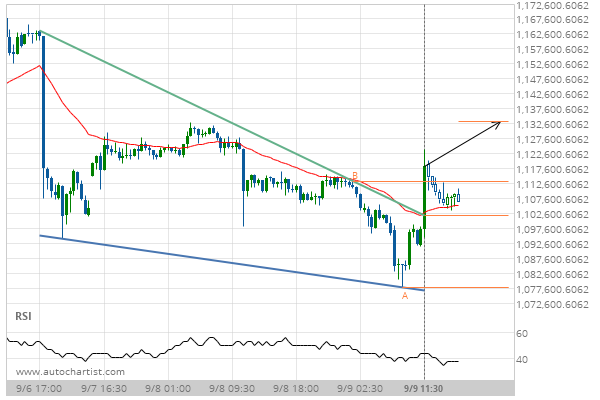
After testing the support line numerous times, 10 year US Treasury Note DECEMBER 2019 is once again approaching this line. Can we expect a bearish trend to follow?
The movement of 10 year US Treasury Note DECEMBER 2019 towards the support line of a Falling Wedge…
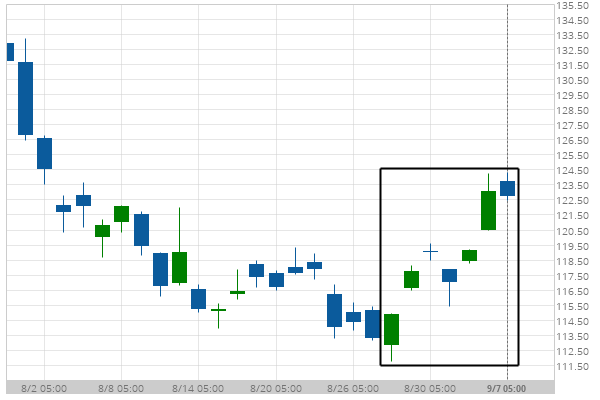
Caterpillar Inc. moves higher to 122.7 in the last 11 days.
A movement of 8.72% over 11 days on Caterpillar Inc. doesn’t go unnoticed. You may start considering where…
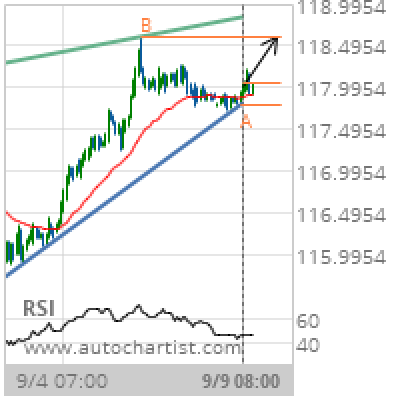
EUR/JPY Target Level: 118.6100
Rising Wedge identified at 09-Sep-2019 08:00 UTC. This pattern is still in the process of forming. Possible bullish price movement towards the resistance 118.6100 within the next 2 days. Supported by Upward sloping Moving Average Chart 1 hourPattern Rising WedgeLength 161 CandlesIdentified 09-Sep-2019 08:00 UTC
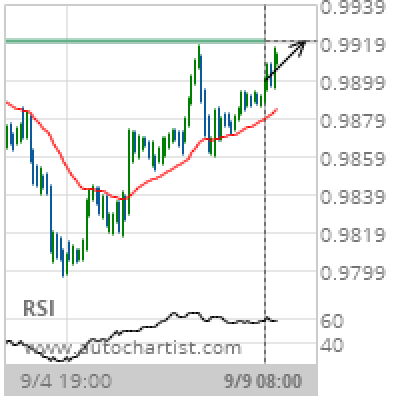
USD/CHF Target Level: 0.9919
Approaching Resistance level of 0.9919 identified at 09-Sep-2019 08:00 UTC Supported by Upward sloping Moving Average Chart 1 hourPattern ResistanceLength 134 CandlesIdentified 09-Sep-2019 08:00 UTC
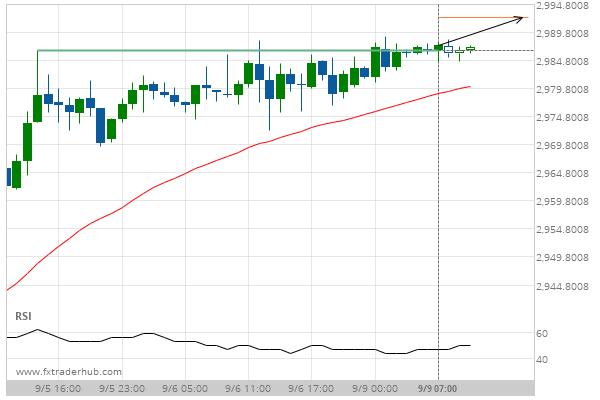
After testing 2986.5000 numerous times, SPX500 has finally broken through. Can we expect a bullish trend to follow?
The breakout of SPX500 through the 2986.5000 price line is a breach of an important psychological price that…