
Day: August 20, 2019
21 posts
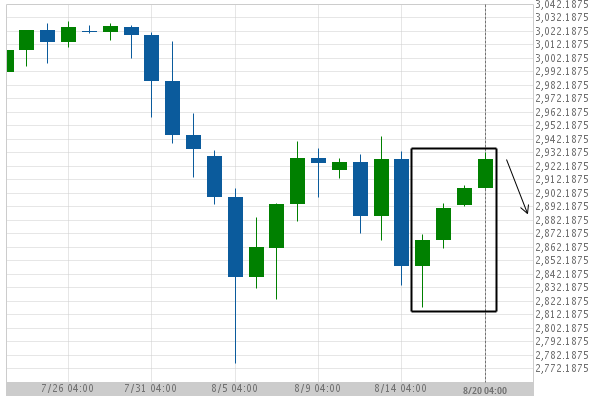
After experiencing 4 consecutive daily bullish candles in the space of 6 days, nobody knows where SPX500 is headed.
Those of you that are trend followers are probably eagerly watching SPX500 to see if its latest 4…
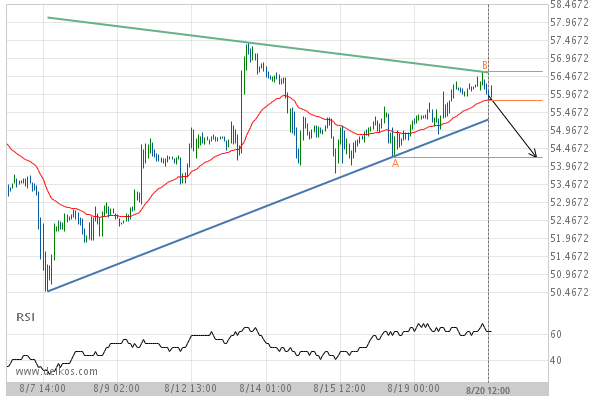
Light Sweet Crude Oil OCTOBER 2019 – approaching a support line that has been previously tested at least twice in the past
Light Sweet Crude Oil OCTOBER 2019 is moving towards the support line of a Triangle. Because we have…
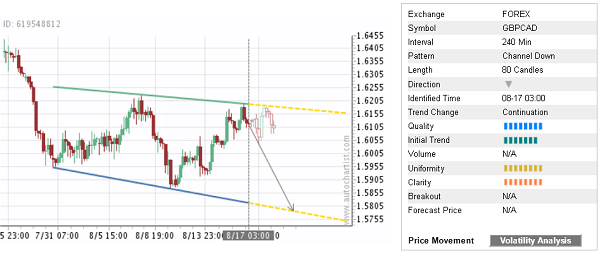
Trade of the Day: GBP/CAD
By: Dima Chernovolov GBP/CAD continues to fall inside the 4-hour Down Channel chart pattern which was identified previously by Autochartist. Autochartist rates the quality of this Down Channel at the 8-bar level – which is the result of the fast Initial Trend (7 bars) and strong medium Uniformity and Clarity (8 bars). GBP/CAD is expected…
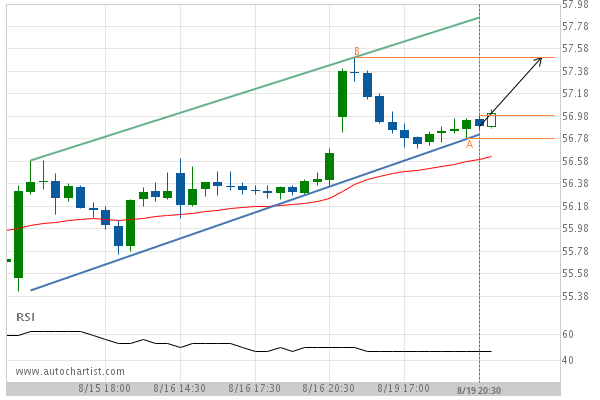
Verizon Communications Inc. is approaching a resistance line of a Channel Up. It has touched this line numerous times in the last 5 days.
Verizon Communications Inc. is approaching the resistance line of a Channel Up. It has touched this line numerous…
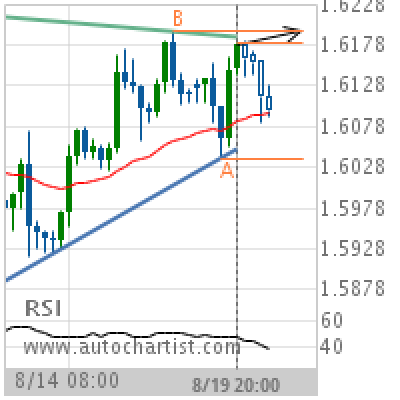
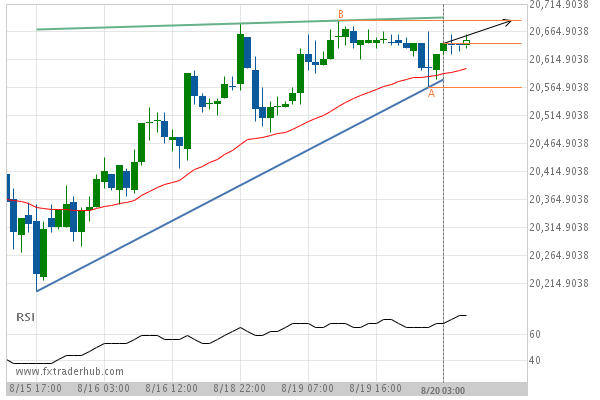
GBP/CAD Target Level: 1.6194
Triangle identified at 19-Aug-2019 20:00 UTC. This pattern is still in the process of forming. Possible bullish price movement towards the resistance 1.6194 within the next 2 days. Supported by RSI below 40 Chart 4 hourPattern TriangleLength 50 CandlesIdentified 19-Aug-2019 20:00 UTC
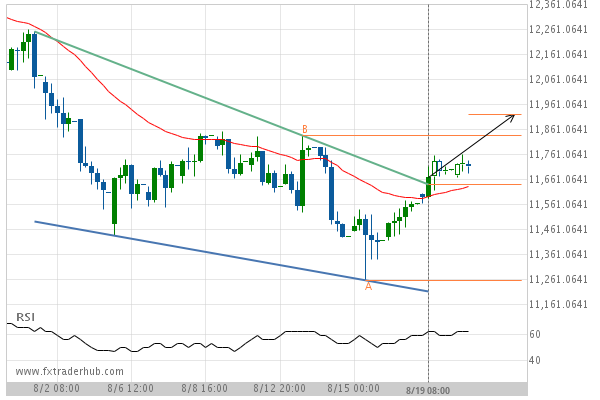
Resistance line breached by GER30. This price has been tested at least twice before.
GER30 has broken through the resistance line which it has tested twice in the past. We have seen…
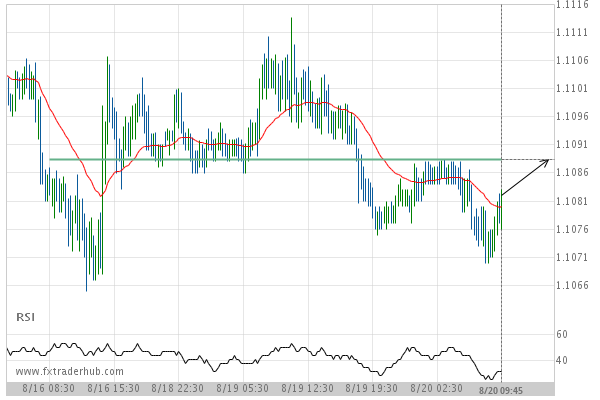
A final push expected on EUR/USD as it starts approaching a price line of 1.1089.
EUR/USD is heading towards a price line of 1.1089 and could reach this point within the next 12…
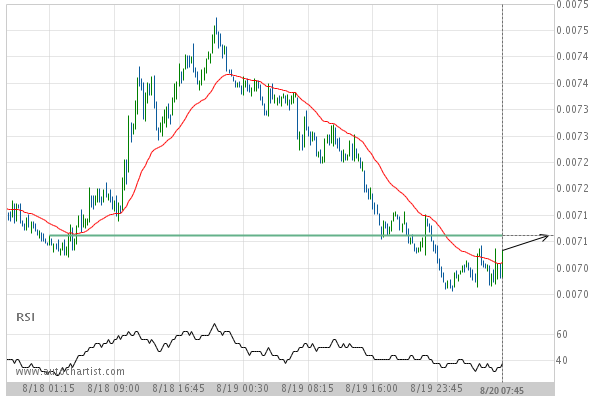
LTCBTC is quickly approaching 0.0071. We expect either a breakout through this line, or a rebound.
LTCBTC is heading towards a line of 0.0071. If this movement continues, we expect the price of LTCBTC…
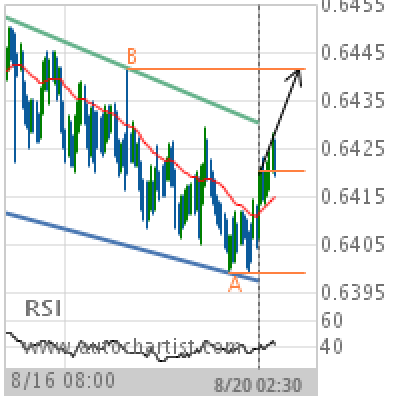
NZD/USD Target Level: 0.6442
Channel Down identified at 20-Aug-2019 02:30 UTC. This pattern is still in the process of forming. Possible bullish price movement towards the resistance 0.6442 within the next day. Supported by Upward sloping Moving Average Chart 30 MinutesPattern Channel DownLength 188 CandlesIdentified 20-Aug-2019 02:30 UTC
Important resistance line being approached by JPN225. This price has been tested numerous time in the last 5 days
JPN225 is moving towards the resistance line of a Ascending Triangle which it has tested numerous times in…