
Day: June 17, 2019
17 posts
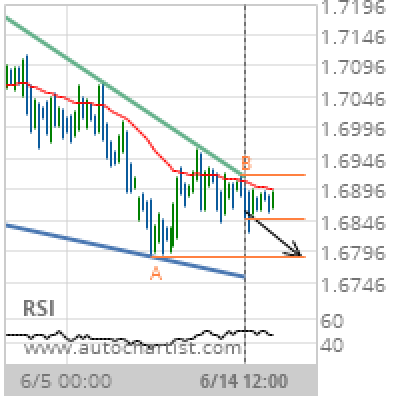
GBP/CAD Target Level: 1.6788
Falling Wedge identified at 14-Jun-2019 12:00 UTC. This pattern is still in the process of forming. Possible bearish price movement towards the support 1.6788 within the next 3 days. Supported by Downward sloping Moving Average Chart 4 hourPattern Falling WedgeLength 104 CandlesIdentified 14-Jun-2019 12:00 UTC
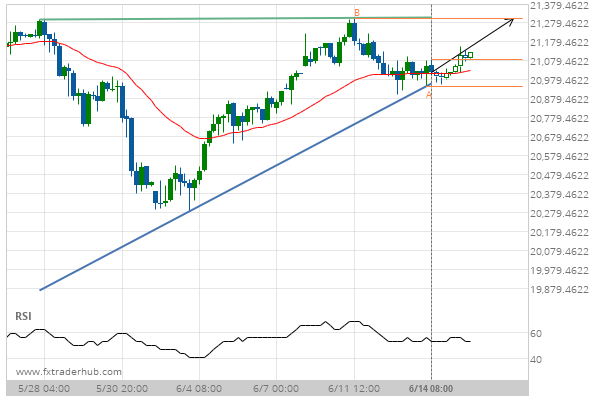
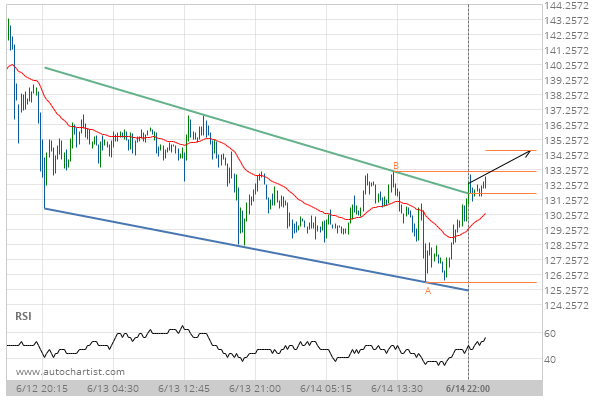
After testing the resistance line numerous times, JPN225 is once again approaching this line. Can we expect a bullish trend to follow?
The movement of JPN225 towards the resistance line of a Ascending Triangle is yet another test of the…
A quick move expected on ETHUSD as it starts approaching a resistance line of a Channel Up
ETHUSD is heading towards the resistance line of a Channel Up and could reach this point within the…
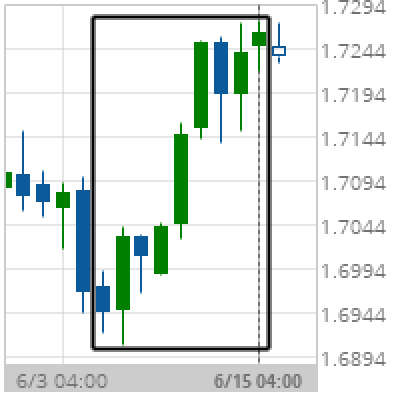
Big Movement EUR/NZD
EUR/NZD experienced a 1.7% bullish movement in the last 10 days. Chart DailyPattern Big MovementLength 9 CandlesIdentified 15-Jun-2019 04:00 UTC
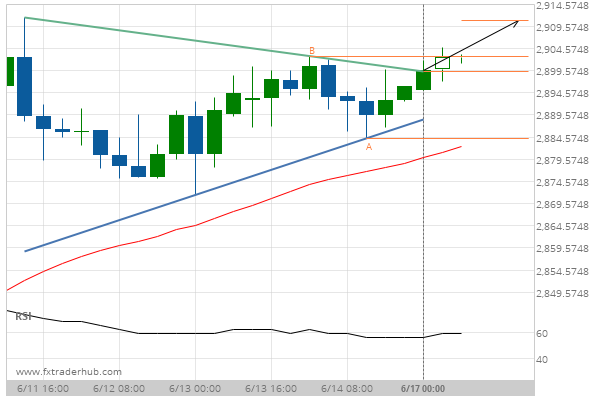
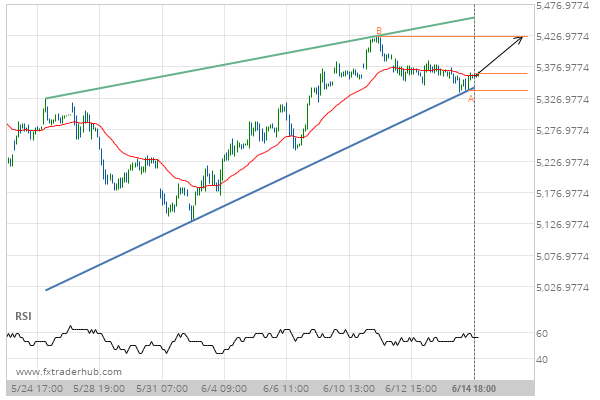
Resistance line breached by SPX500. This price has been tested at least twice before.
SPX500 has broken through the resistance line which it has tested twice in the past. We have seen…
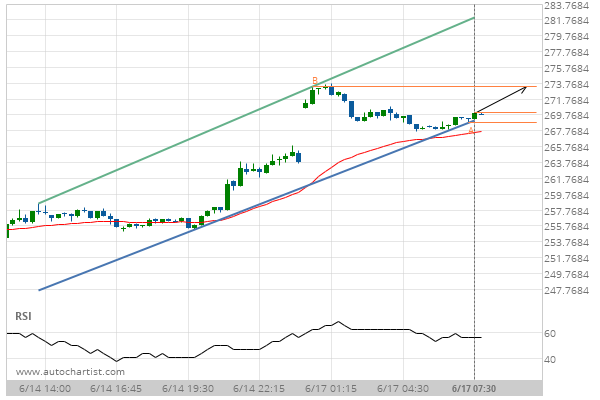
After testing the resistance line numerous times, FRA40 is once again approaching this line. Can we expect a bullish trend to follow?
The movement of FRA40 towards the resistance line of a Rising Wedge is yet another test of the…
After testing resistance twice in the past, LTCUSD has finally broken through. Can we expect a bullish trend to follow?
The breakout of LTCUSD through the resistance line of a Falling Wedge could be a sign of the…