
Day: June 5, 2019
18 posts
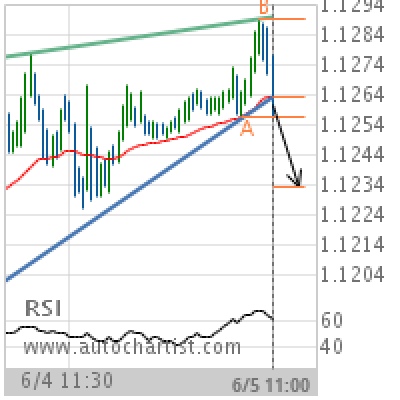
EUR/USD Target Level: 1.1233
Rising Wedge has broken through the support line at 05-Jun-2019 11:00 UTC. Possible bearish price movement forecast for the next 17 hours towards 1.1233. Supported by RSI above 60 Chart 30 MinutesPattern Rising WedgeLength 104 CandlesIdentified 05-Jun-2019 11:00 UTC
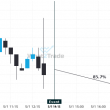
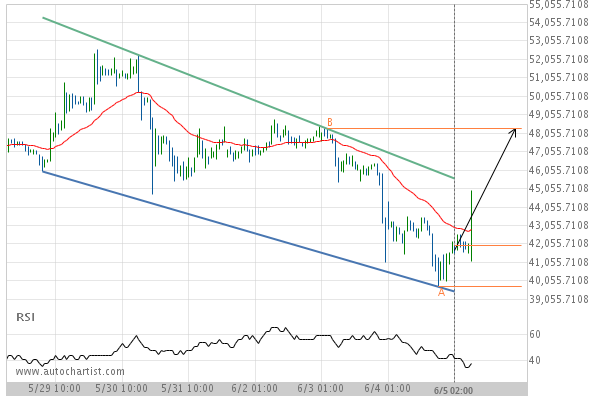
Resistance line breached by FRA40. This price has been tested at least twice before.
FRA40 has broken through the resistance line which it has tested twice in the past. We have seen…
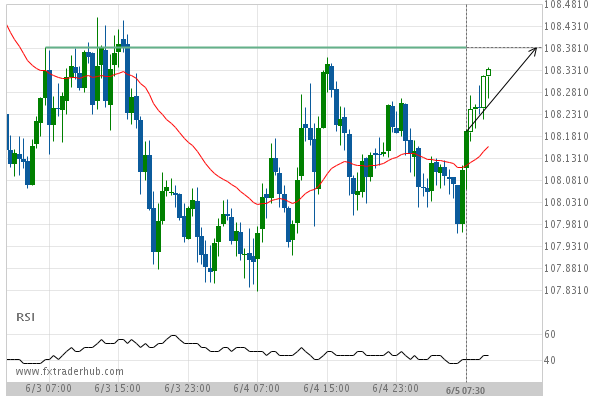
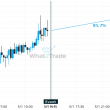
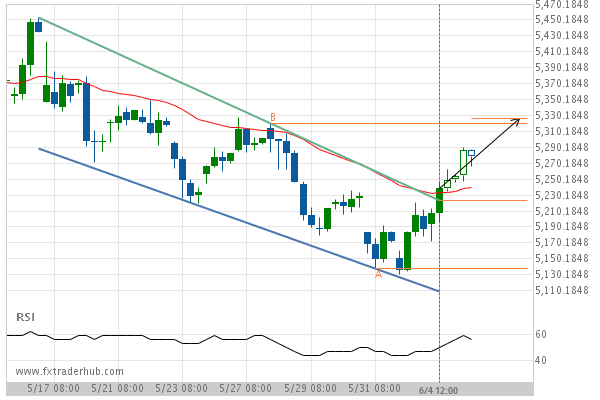
USD/JPY is approaching the resistance line of a Resistance. It has touched this line numerous times in the last 3 days.
USD/JPY is approaching the resistance line of a Resistance. It has touched this line numerous times in the…
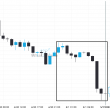
Important resistance line being approached by BCHJPY. This price has been tested numerous time in the last 7 days
BCHJPY is moving towards the resistance line of a Channel Down which it has tested numerous times in…
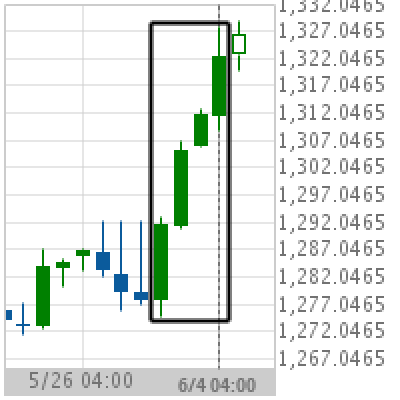
Big Movement XAU/USD
XAU/USD experienced a 3.48% bullish movement in the last 5 days. Chart DailyPattern Big MovementLength 4 CandlesIdentified 04-Jun-2019 04:00 UTC
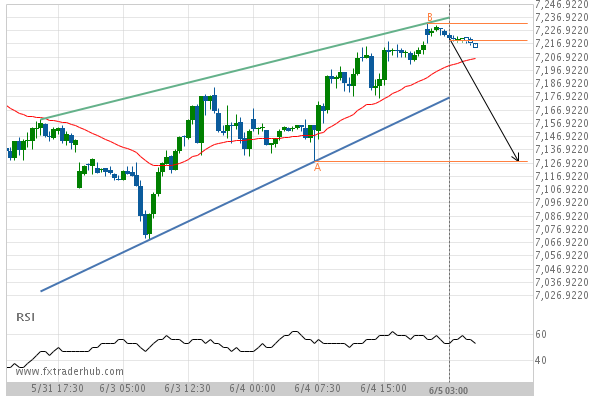
A quick move expected on UK100 as it starts approaching a support line of a Rising Wedge
UK100 is heading towards the support line of a Rising Wedge and could reach this point within the…
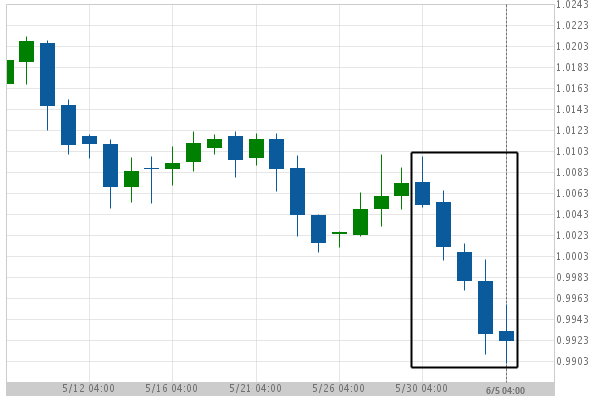
USD/CHF moves lower to 0.992 in the last 7 days.
A movement of 1.5% over 7 days on USD/CHF doesn’t go unnoticed. You may start considering where it’s…
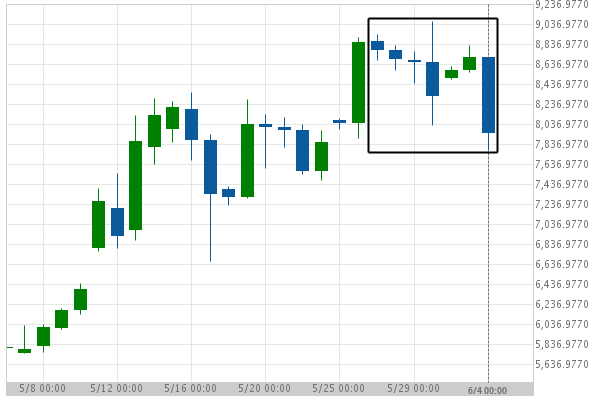
BTCUSD experienced a very large 9 days bearish move to 7,945.94
BTCUSD has moved lower by 10.35% from 8,863.7 to 7,945.94 in the last 9 days.