
Day: May 29, 2019
14 posts
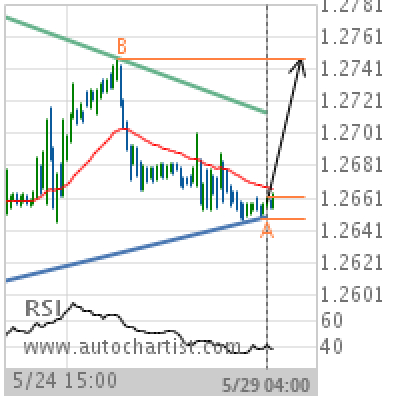
GBP/USD Target Level: 1.2748
Triangle identified at 29-May-2019 04:00 UTC. This pattern is still in the process of forming. Possible bullish price movement towards the resistance 1.2748 within the next 2 days. Supported by RSI below 40 Chart 1 hourPattern TriangleLength 133 CandlesIdentified 29-May-2019 04:00 UTC
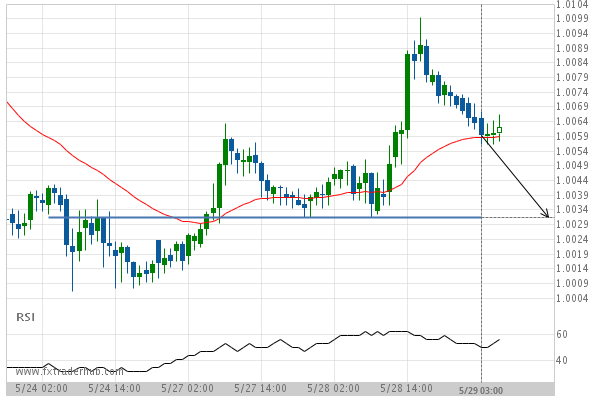
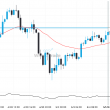
USD/CHF is approaching the support line of a Support. It has touched this line numerous times in the last 6 days.
USD/CHF is approaching the support line of a Support. It has touched this line numerous times in the…
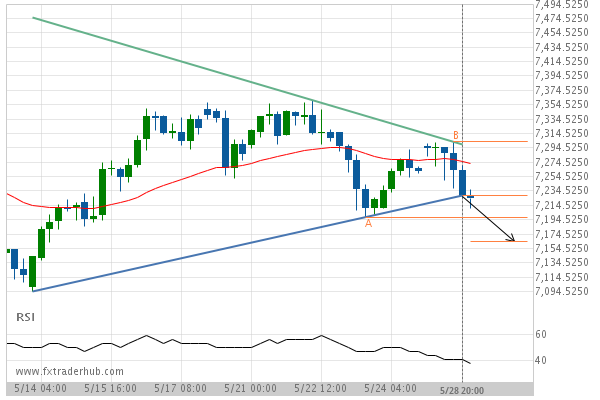
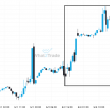
After testing support twice in the past, UK100 has finally broken through. Can we expect a bearish trend to follow?
The breakout of UK100 through the support line of a Triangle could be a sign of the road…
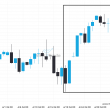
BTCCAD is quickly approaching the support line of a Channel Up. We expect either a breakout through this line or a rebound.
BTCCAD is heading towards the support line of a Channel Up. If this movement continues, we expect the…