
Day: May 23, 2019
19 posts
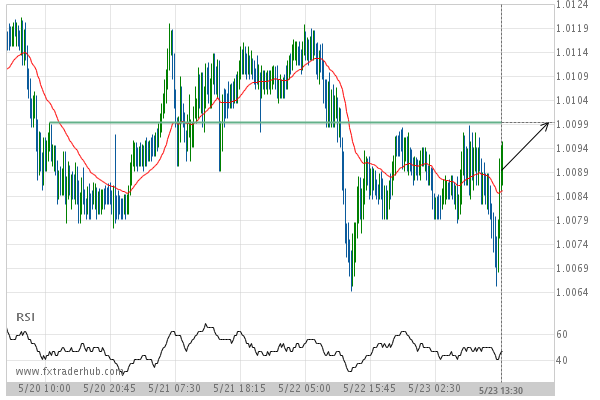
USD/CHF is quickly approaching 1.0099. We expect either a breakout through this line, or a rebound.
USD/CHF is heading towards a line of 1.0099. If this movement continues, we expect the price of USD/CHF…
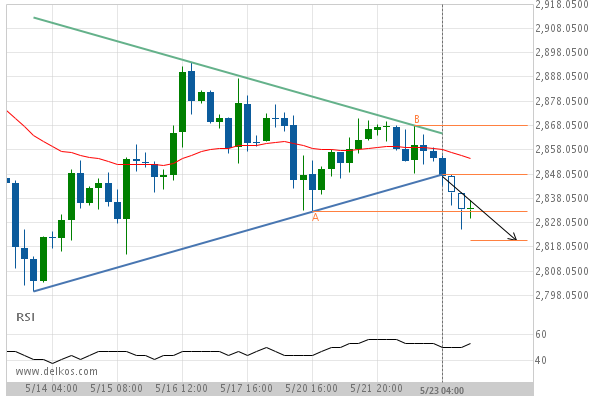
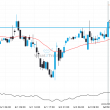
E-mini S&P 500 JUNE 2019 – breach of a trending support line that has been tested at least twice before.
E-mini S&P 500 JUNE 2019 has broken through the support line of a Triangle technical chart pattern. Because…
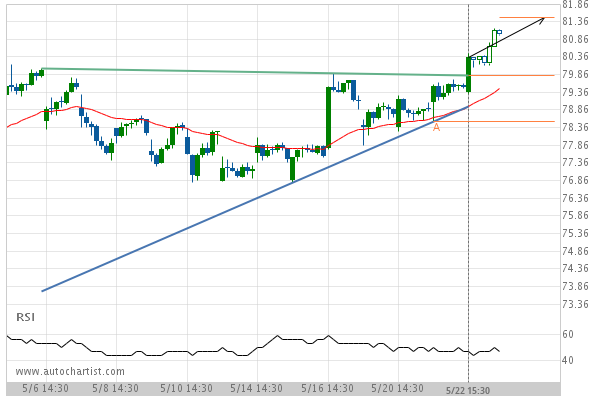
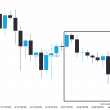
Breach of resistance could mean a start of a bullish trend on Merck & Co. Inc.
Merck & Co. Inc. has broken through a resistance line of a Ascending Triangle chart pattern. If this…
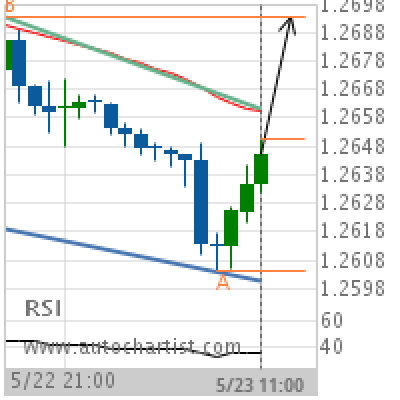
GBP/USD Target Level: 1.2694
Channel Down identified at 23-May-2019 11:00 UTC. This pattern is still in the process of forming. Possible bullish price movement towards the resistance 1.2694 within the next 9 hours. Supported by RSI below 40 Chart 1 hourPattern Channel DownLength 29 CandlesIdentified 23-May-2019 11:00 UTC
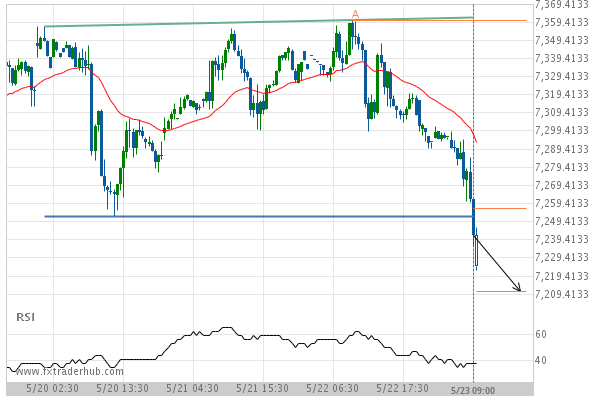
After testing support twice in the past, UK100 has finally broken through. Can we expect a bearish trend to follow?
The breakout of UK100 through the support line of a Double Top could be a sign of the…
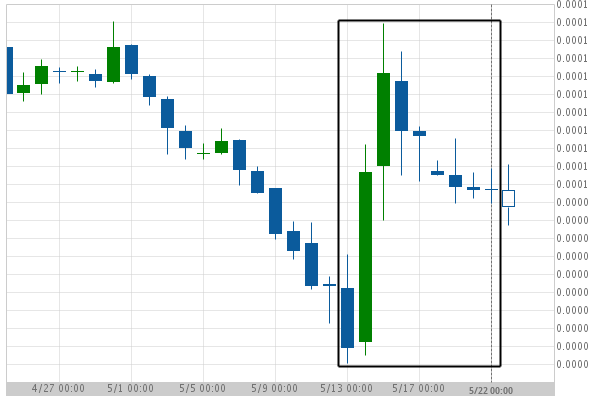
XRPBTC experienced a very large 10 days bullish move to 0
XRPBTC has moved higher by 12.2% from 0 to 0 in the last 10 days.
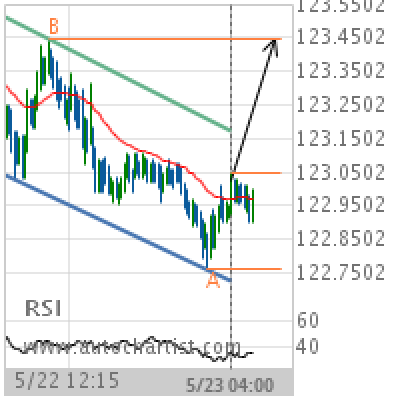
EUR/JPY Target Level: 123.4450
Channel Down identified at 23-May-2019 04:00 UTC. This pattern is still in the process of forming. Possible bullish price movement towards the resistance 123.4450 within the next 11 hours. Supported by RSI below 40 Chart 15 MinutesPattern Channel DownLength 148 CandlesIdentified 23-May-2019 04:00 UTC
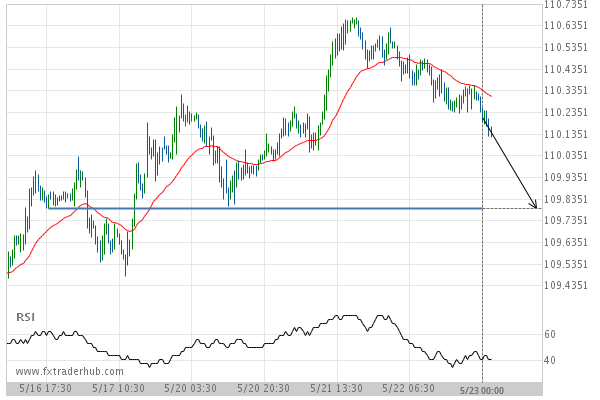
USD/JPY is approaching the support line of a Support. It has touched this line numerous times in the last 7 days.
USD/JPY is approaching the support line of a Support. It has touched this line numerous times in the…
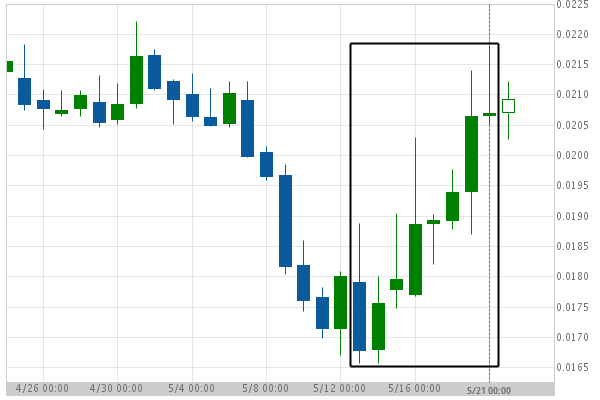
DASHBTC experienced a very large 9 days bullish move to 0.021
DASHBTC has moved higher by 15.57% from 0.018 to 0.021 in the last 9 days.