
Day: May 16, 2019
20 posts

As with virtually any trading scenario, we must first determine the direction that we need to trade the pair for the greatest likelihood of success. By looking at the historical 4 hour chart of the GBPUSD below, there are several reasons we know that we want to go long (buy) the pair. Price action is…
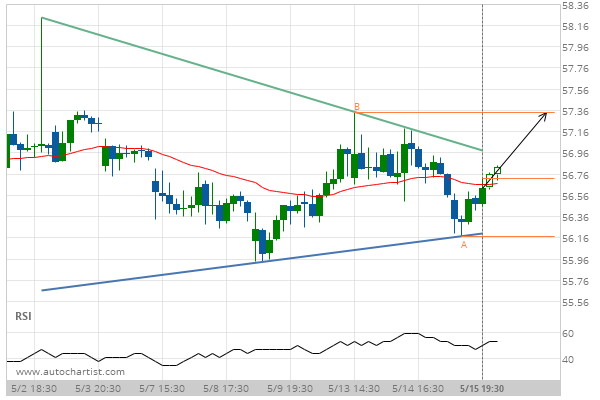
Verizon Communications Inc. – approaching a resistance line that has been previously tested at least twice in the past
Verizon Communications Inc. is moving towards the resistance line of a Triangle. Because we have seen it retrace…
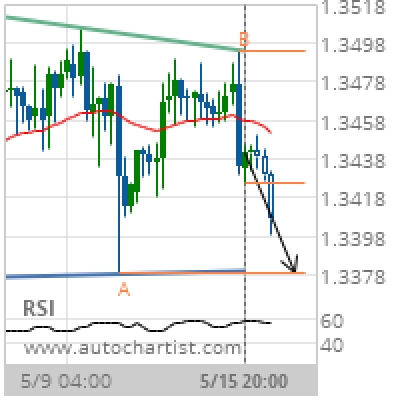
USD/CAD Target Level: 1.3378
Descending Triangle identified at 15-May-2019 20:00 UTC. This pattern is still in the process of forming. Possible bearish price movement towards the support 1.3378 within the next 3 days. Supported by Downward sloping Moving Average Chart 4 hourPattern Descending TriangleLength 66 CandlesIdentified 15-May-2019 20:00 UTC
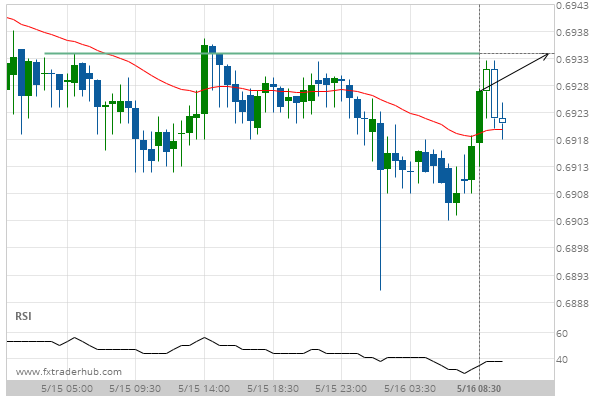
AUD/USD is quickly approaching 0.6934. We expect either a breakout through this line, or a rebound.
AUD/USD is heading towards a line of 0.6934. If this movement continues, we expect the price of AUD/USD…
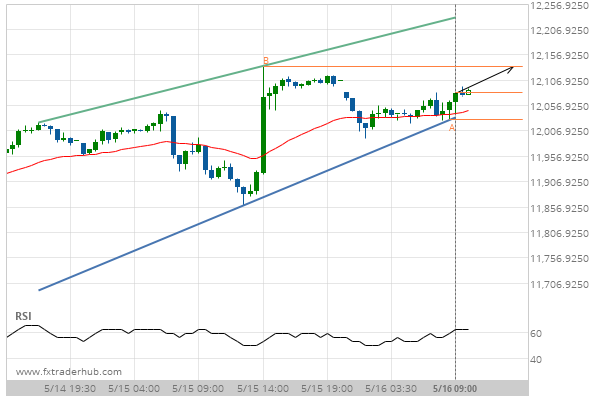
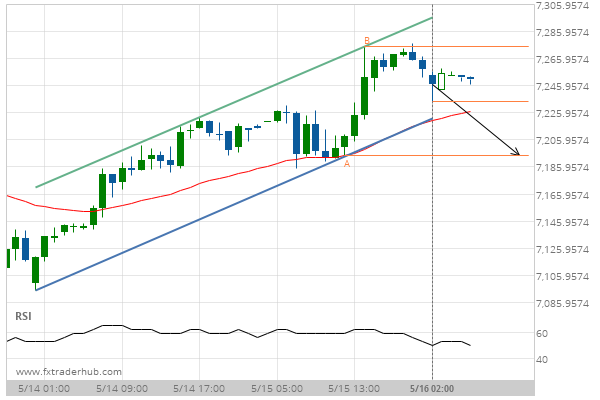
A quick move expected on GER30 as it starts approaching a resistance line of a Rising Wedge
GER30 is heading towards the resistance line of a Rising Wedge and could reach this point within the…
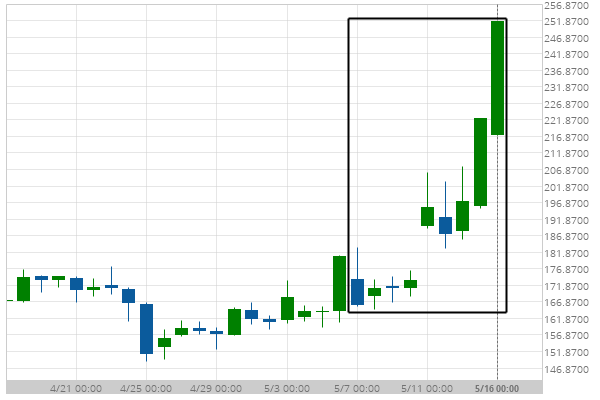
ETHUSD hits 248.64 after a 43.14% move spanning 10 days
For those of you that don’t believe in trends, this may be an opportunity to take advantage of…
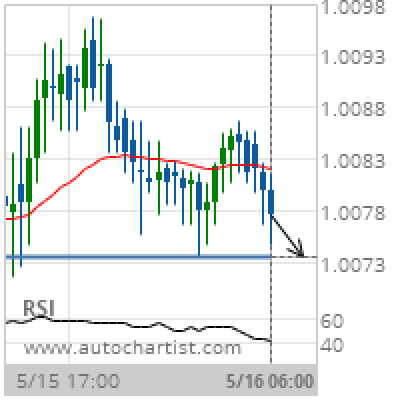
USD/CHF Target Level: 1.0074
Approaching Support level of 1.0074 identified at 16-May-2019 06:00 UTC Supported by Downward sloping Moving Average Chart 30 MinutesPattern SupportLength 58 CandlesIdentified 16-May-2019 06:00 UTC
A quick move expected on UK100 as it starts approaching a support line of a Channel Up
UK100 is heading towards the support line of a Channel Up and could reach this point within the…
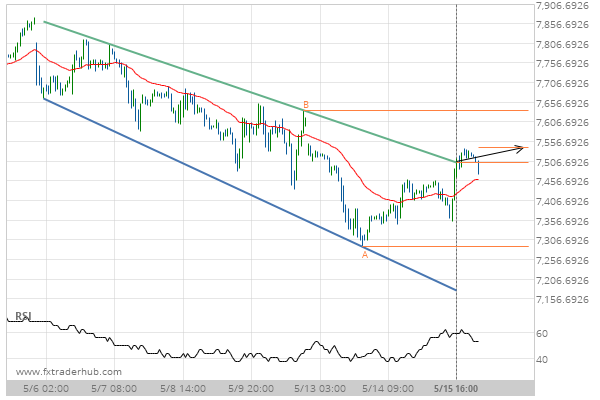
After testing resistance twice in the past, NAS100 has finally broken through. Can we expect a bullish trend to follow?
The breakout of NAS100 through the resistance line of a Channel Down could be a sign of the…
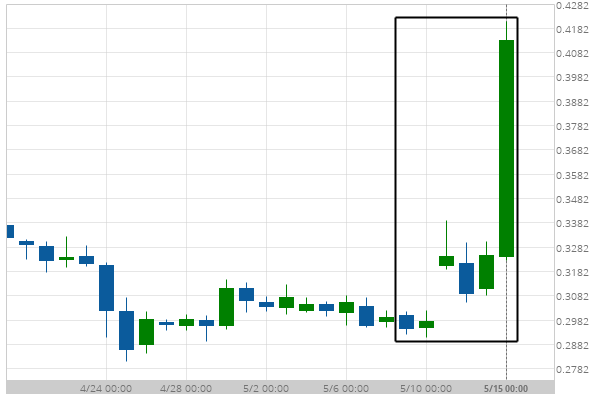
XRPUSD experienced a very large 7 days bullish move to 0.408
XRPUSD has moved higher by 35.74% from 0.3 to 0.408 in the last 7 days.