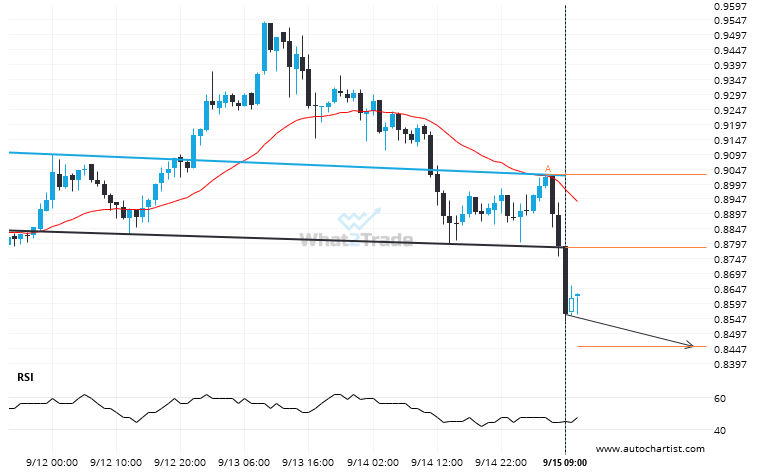
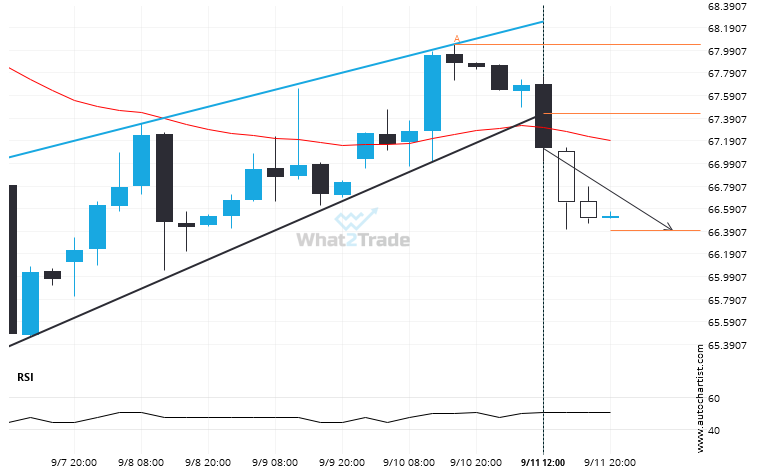
You would be well advised to confirm the breakout that has just occurred – do you…
LATEST POSTS
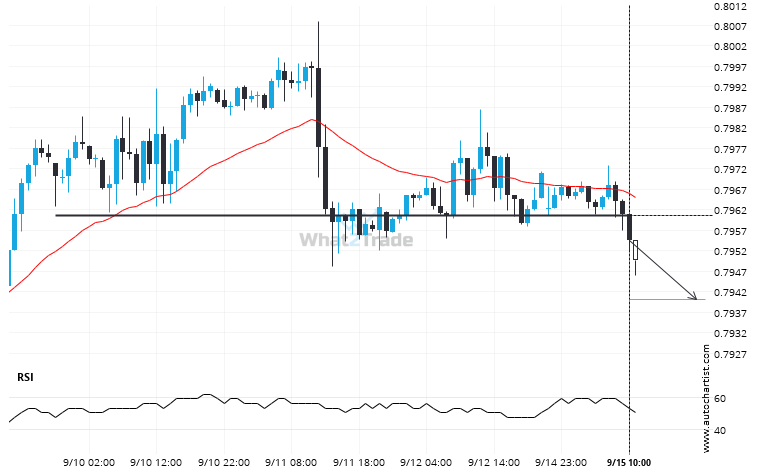
After testing 0.7961 numerous times, USDCHF has finally broken through. Can we expect a bearish trend to follow?
USDCHF has broken through a support line. It has touched this line numerous times in the…
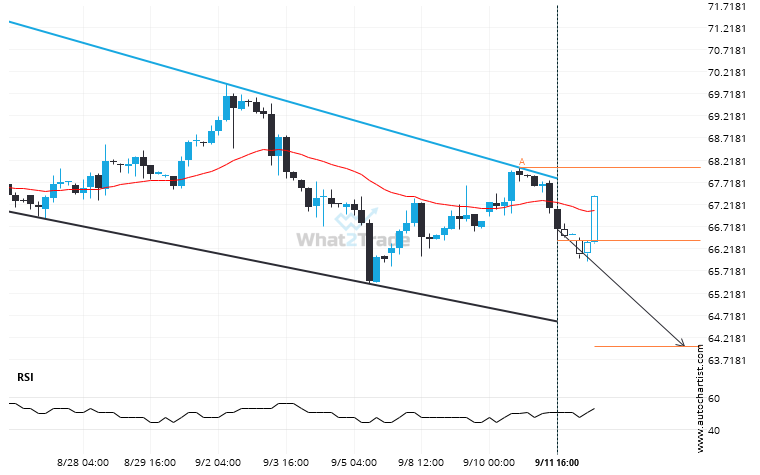
A possible move on Brent Crude as it heads towards support
The movement of Brent Crude towards the support line of a Channel Down is yet another test…
After testing support twice in the past, ADAUSD has finally broken through. Can we expect a bearish trend to follow?
You would be well advised to confirm the breakout that has just occurred – do you…
Economic Events Forecast
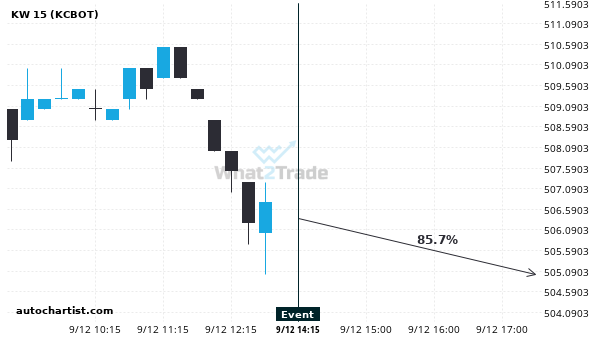
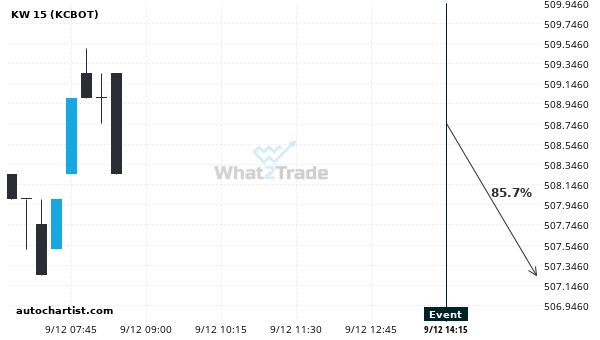
We expect KW to trend downwards for the next 4 hours.
We expect a $3040 movement on KW within the next 4 hours. We expect KW to trend downwards 4…
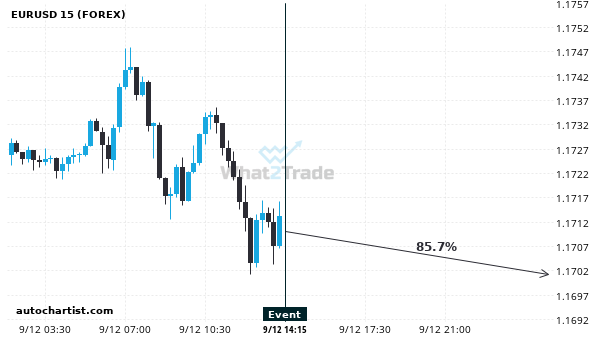
We expect a 79 pip movement on EURUSD within 12 hours following the event release.
Based on the last 12 Michigan Consumer Sentiment Prel events in United States, we expect a…
We expect KW to trend downwards today with a 85.71% chance.
Based on the last 12 Michigan Consumer Sentiment Prel events in United States, we expect KW…
US Stocks
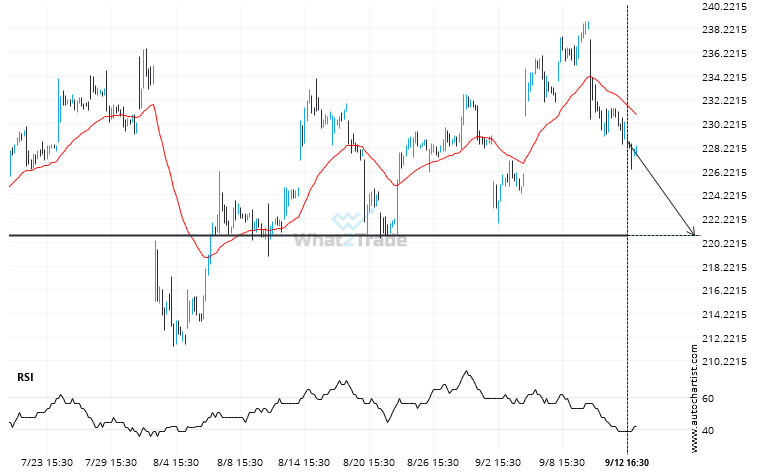
AMZN seems to be on its way to support – a possible opportunity?
AMZN is moving towards a support line. Because we have seen it retrace from this level in…
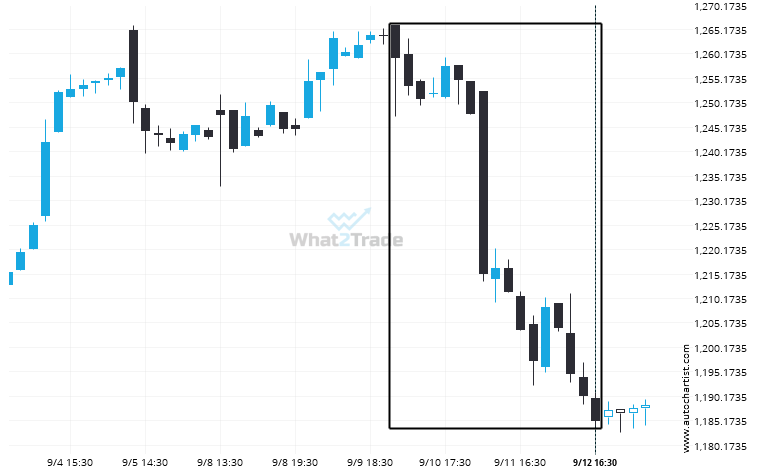
NFLX reached 1185.06 after a 5.9% move spanning 3 days.
NFLX has moved lower by 5.9% from 1259.325 to 1185.06 in the last 3 days.
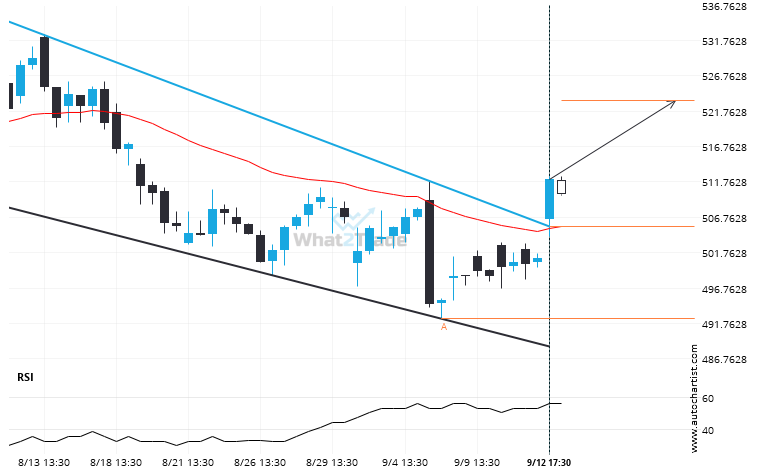
Resistance line breached by MSFT. This price has been tested at least twice before.
MSFT has broken through a resistance line of a Channel Down chart pattern. If this breakout…
Crypto
After testing support twice in the past, ADAUSD has finally broken through. Can we expect a bearish trend to follow?
You would be well advised to confirm the breakout that has just occurred – do you…
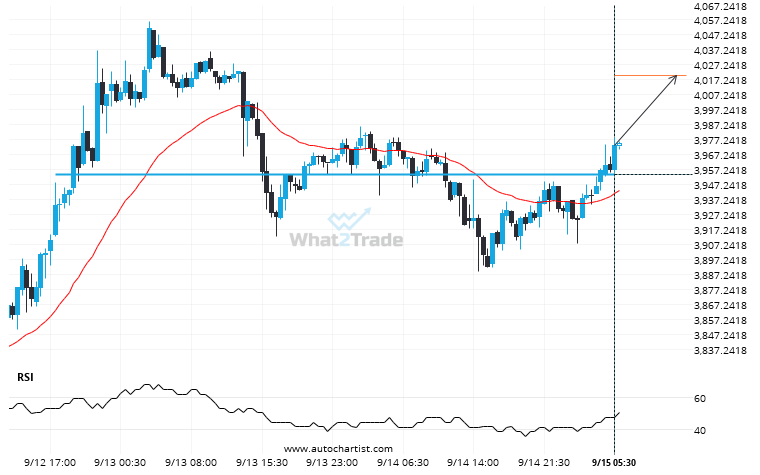
It’s time to make a decision on ETHEUR – its recent breach of 3953.8899 could be a sign of a new trend to follow.
ETHEUR has breached the resistance line at 3953.8899. It may continue the bullish trend…
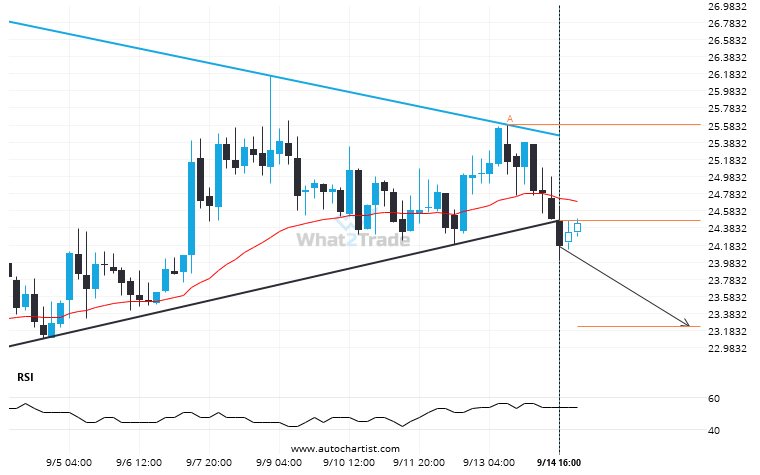
A possible move by DASHUSD towards 23.2361
DASHUSD has broken through a support line of a Triangle chart pattern. If this breakout…
Forex
After testing 0.7961 numerous times, USDCHF has finally broken through. Can we expect a bearish trend to follow?
USDCHF has broken through a support line. It has touched this line numerous times in the…
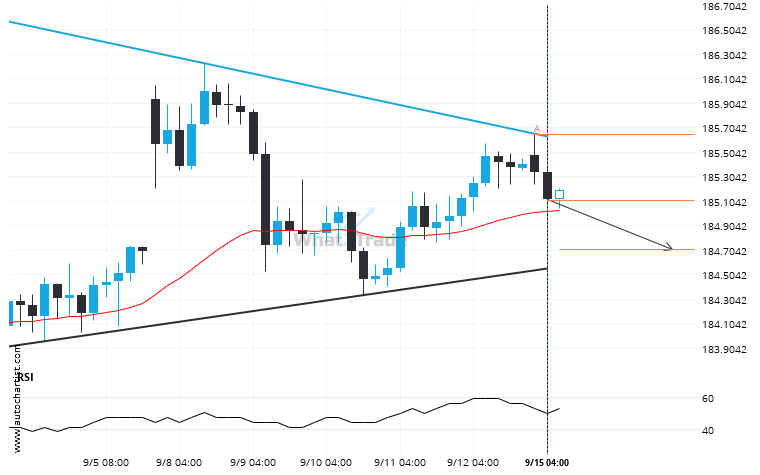
Because CHFJPY formed a Triangle pattern, we expect it to touch the support line. If it breaks through support it may move much lower
CHFJPY is heading towards the support line of a Triangle and could reach this point within…
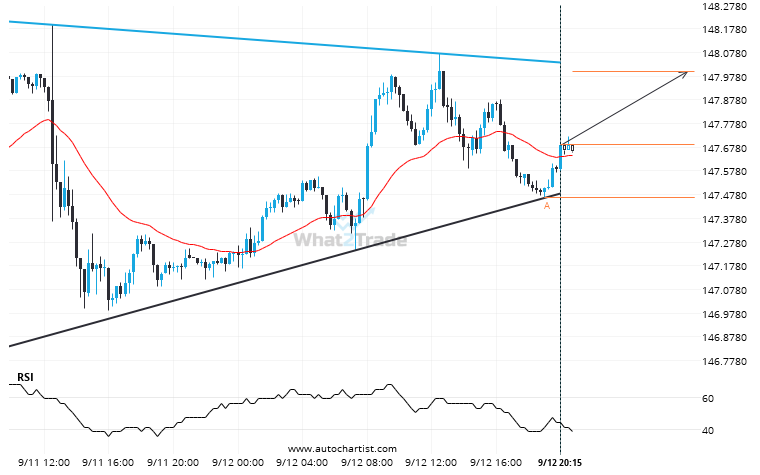
A Triangle has formed, USDJPY is approaching support. Can we expect a breakout and the start of a new trend or a reversal?
An emerging Triangle has been detected on USDJPY on the 15 Minutes chart. There is a…
Global Indices
Because NAS 100 formed a Channel Up pattern, we expect it to touch the resistance line. If it breaks through resistance it may move much higher
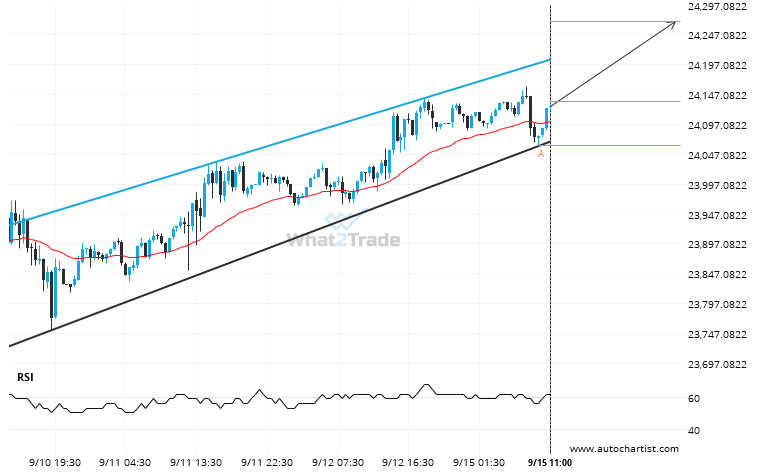
NAS 100 is approaching the resistance line of a Channel Up. It has touched this line…
DAX 40 keeps moving closer towards 23863.9004. Will it finally breach this level?
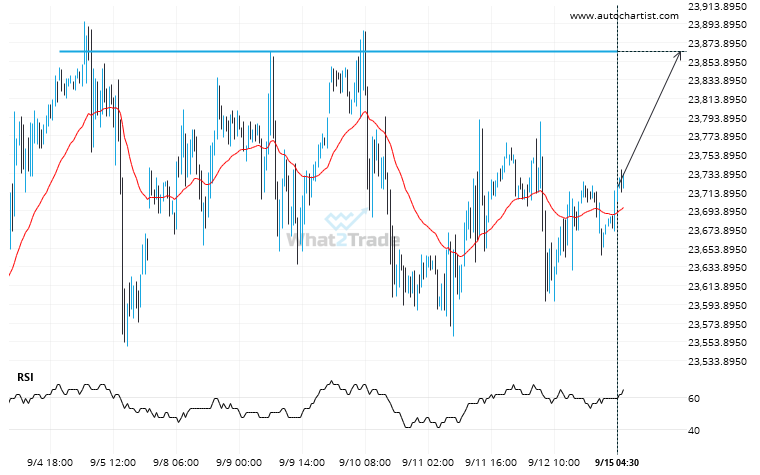
DAX 40 is about to retest a key horizontal resistance level near 23863.9004. It has tested…
Breach of support could mean a start of a bearish trend on US 500
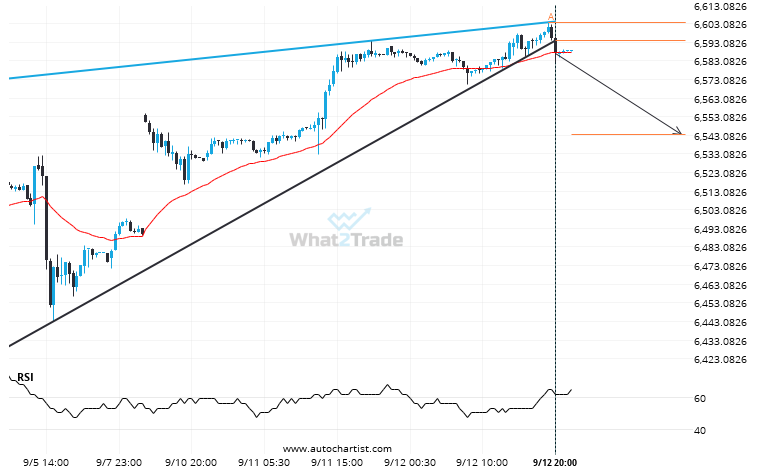
This trade setup on US 500 is formed by a period of consolidation; a period in which the…
Futures
A possible move on Brent Crude as it heads towards support
The movement of Brent Crude towards the support line of a Channel Down is yet another test…
Gold Spot has broken through a resistance line. It has touched this line numerous times in the last 3 days.
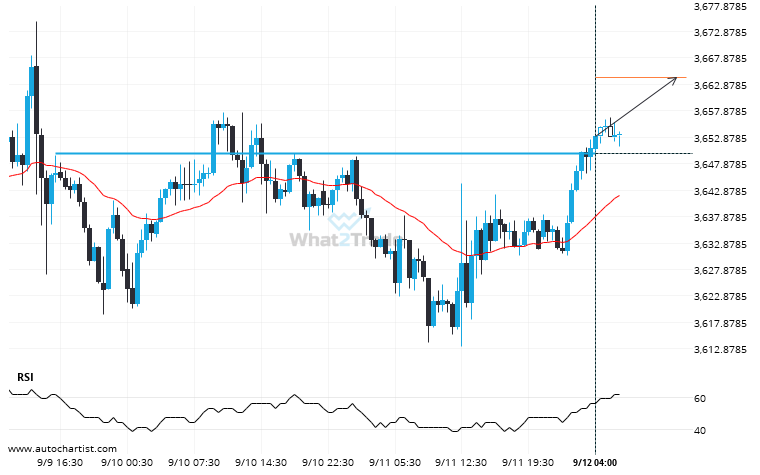
Gold Spot has broken through a line of 3649.8000 and suggests a possible movement to…
Interesting opportunity on Brent Crude after breaking 67.43627777777779
Brent Crude moved through the support line of a Pennant at 67.43627777777779 on the 4 hour…

