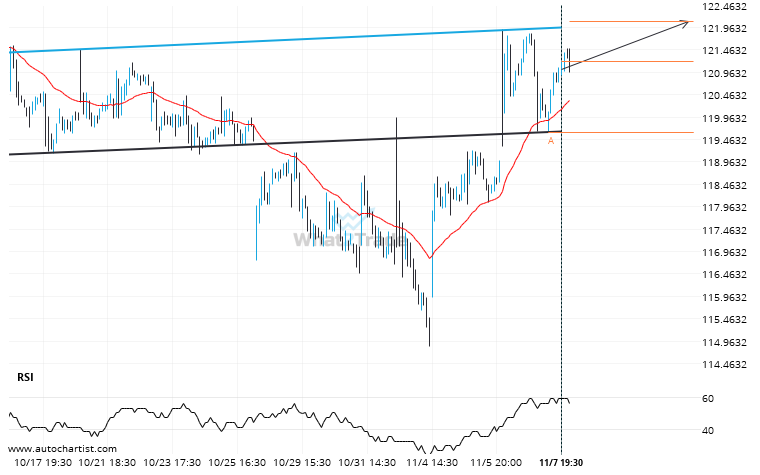
Emerging Inverse Head and Shoulders pattern in its final wave was identified on the XOM 30 Minutes chart. After a strong bullish run, we find XOM heading towards the upper triangle line with a possible resistance at 122.1002. If the resistance shows to hold, the Inverse Head and Shoulders pattern suggests a rebound back towards current levels.
Related Posts
ADBE is approaching a support line of a Triangle. It has touched this line numerous times in the last 6 days.
An emerging Triangle has been detected on ADBE on the 30 Minutes chart. There is a possible move…
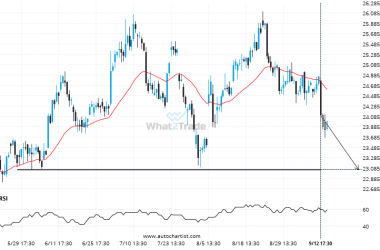
Will PFE break through the support level it tested before?
PFE is heading towards 23.0550 and could reach this point within the next 3 days. It has tested…
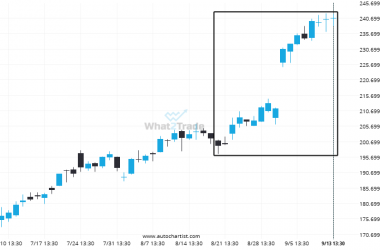
Big bullish swing on GOOGL – this may be one of its more notable movements in the recent session.
A movement of 20.79% over 25 days on GOOGL doesn’t go unnoticed. You may start considering where it’s…

