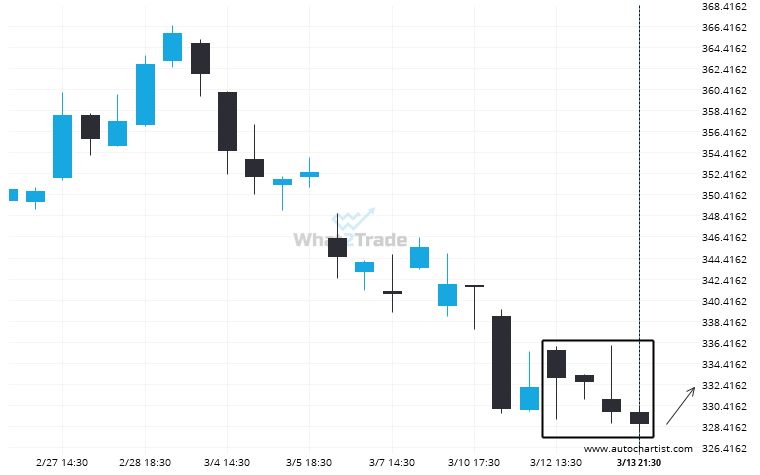
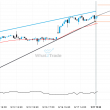
For those of you that don’t believe in trends, this may be an opportunity to take advantage of an exceptionally large amount of consecutive bearish candles on V. The movement has happened over the last 2 days. For those trend followers among you, you may think about riding this possible trend.
Related Posts
V has broken out from the Triangle pattern. Expect it to hit 347.5407 soon.
The breakout of V through the resistance line of a Triangle could be a sign of the road…
META hits 484.52 after a 17.22% move spanning 14 days
Those of you that are trend followers are probably eagerly watching META to see if its latest 17.22%…
AMZN experienced 5 consecutive daily bearish candles to reach a price of 167.3600
Due to the rate of consecutive bearish candles on AMZN Daily chart we could be in for a…