Buying into a bullish trend on the dips is a popular long term strategy. You focus on the USD/JPY or any other pair that is on a long term bullish trend, wait for it to dip and jump in. You buy when the pair is low and just wait for the trend to continue.
Yet as simple as that may sound, too many traders come out bruised from buying on the dip. The dip turns deeper and deeper until it hits your stop loss and you get thrown out. And then, usually, Murphy’s Law kicks in, and shortly after the pair slices through your stop loss, lo and behold, it starts rising. The bullish trend is back, only you’re not riding it.
What you need is a way to figure out how deep the dip is so you can plan your entry and ride on the bullish trend without getting thrown out. One tactic I find to be effective is combining a Gann Fan with an Oscillator. This allows you to predict, with a greater degree of accuracy, the right time to jump in and buy on the dip.
Every Gann Fan Needs an Oscillator
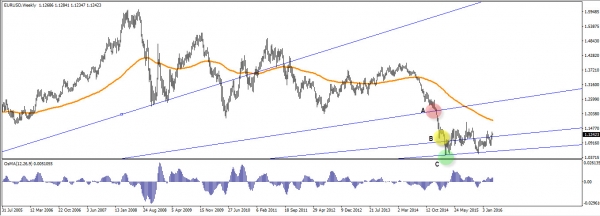
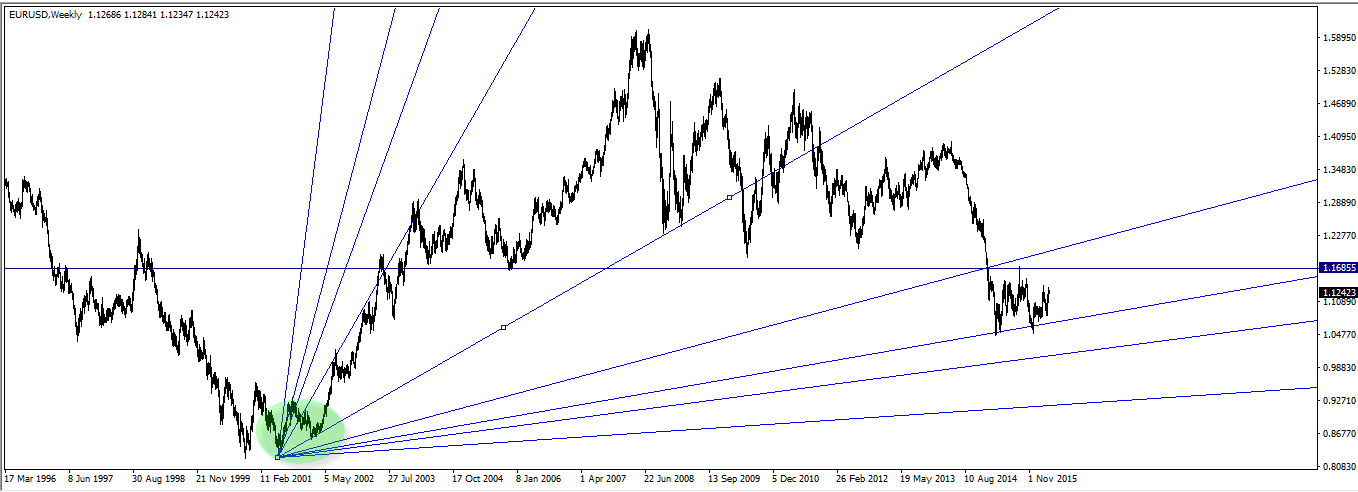
The way a Gann Fan works is simple. You stretch the main Gann line as a trend line support across the trend (see illustration below) and the Gann Fan function gives you alternative trend lines above and below. The problem is that it’s hard to tell which alternative trend line will be the one to actually hold and allow the trend to continue, leaving you no better off than you were without the Gann Fan.
Nevertheless, if we combine the Gann Fan with an oscillator, the Gann Fan becomes much more accurate. Possible oscillators to use are the MACD, Stochastic Oscillator or, in our case, the Moving Average Oscillator. I find the RSI to be less effective in this case, but all those we previously mentioned and some others can work well, as long as you know how to use them.
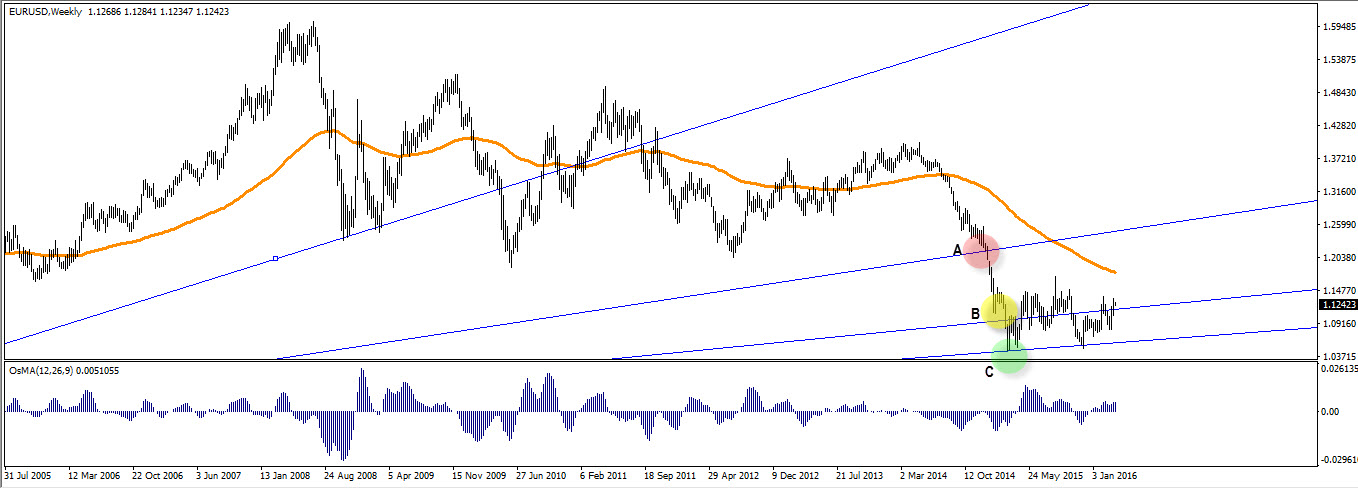
Looking at the sample below, we can see the Gann Fan suggests three possible points for the trend to resume; A, B and C. Both A and B break and fail to hold but C holds. What makes Point C so special? Only in Point C does our Oscillator move from negative to positive, suggesting a change in momentum, and signaling that this is the true support line.
Avoid the Pitfalls
Of course, just as in every strategy, there are pitfalls that you should do your best to avoid. Here are a few tricks to avoid the most common.
Check your Gann: The first thing you’ve got to check (and recheck) is that you’ve drawn the Gann Fan main line on top of the major trend line. You must be sure to start your Gann stretch from where the trend has begun, which will help you recognize the main trend line, as illustrated in the sample below.
Don’t Use Gann for Short Term: While it’s possible to stretch a Gann Fan on short intervals of 1h or less, oscillators are much less effective at those levels. And because oscillators allow the Gann Fan to become more accurate, the lack of an oscillator makes the Gann Fan much less effective and warrants the use of a different set of strategies and tools altogether.
Beware of the Bears: One of the biggest risks of using a Gann Fan, even with oscillators, is that if the trend has changed from bullish to bearish the Gann levels won’t hold. If you failed to recognize the change in trend, a good warning sign is if the pair fails to break the fan above for 2 to 3 times. This is a sign that resistance for the pair is heavy. It could be wise to at least double check that the trend is still bullish and if you are not sure it is then it might be wise to eject and get out of the trade before it’s too late.

