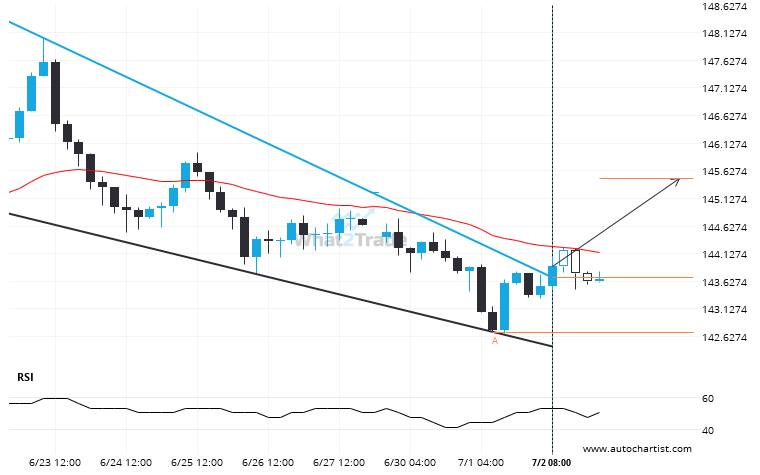
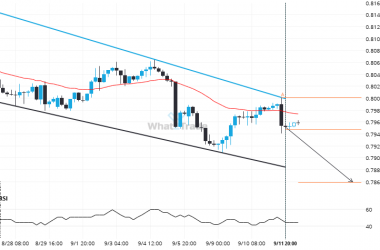
USDJPY moved through the resistance line of a Falling Wedge at 143.70335714285713 on the 4 hour chart. This line has been tested a number of times in the past and this breakout could mean an upcoming change from the current trend. It may continue in its current direction toward 145.4928.
Related Posts
GBPJPY moves lower to 197.0830 in the last 4 days.
GBPJPY has experienced an unusual quantity of bearish candles on the Daily timeframe. This is in the 0.949999988079071…
EURCAD is approaching 1.6008. We expect either a breakout through this line, or a rebound.
EURCAD is moving towards a key support level at 1.6008. EURCAD has previously tested this level 5 times…
Could 6 consecutive daily bearish candles on EURCHF be a sign of things to come?
EURCHF has experienced an unusual quantity of bearish candles on the Daily timeframe. This is in the 0.949999988079071…