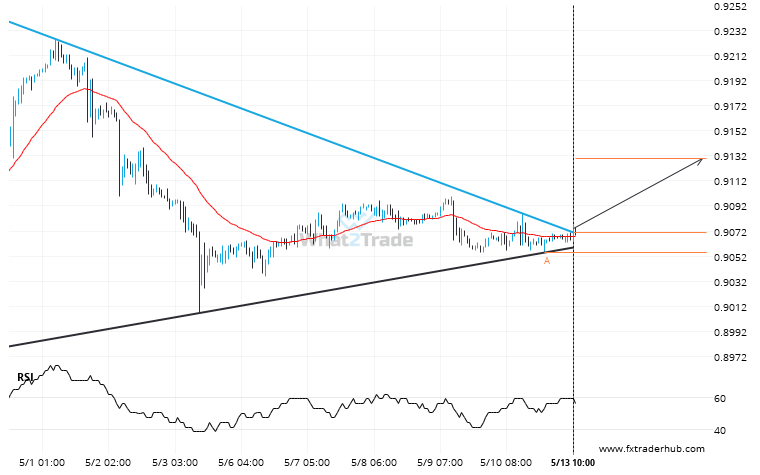
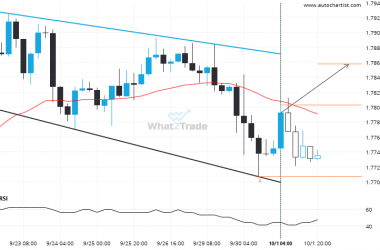
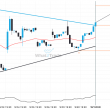
USD/CHF has broken through a resistance line of a Triangle and suggests a possible movement to 0.9129 within the next 3 days. It has tested this line in the past, so one should probably wait for a confirmation of this breakout before taking action. If the breakout doesn’t confirm, we could see a retracement back to lines seen in the last 15 days.
Related Posts
Important price line being approached by NZDUSD. This price has been tested numerous times before.
A strong resistance level has been identified at 0.5947 on the 1 hour NZDUSD chart. NZDUSD is likely…
EURUSD – It’s perhaps in these huge moves where the greatest opportunity lies
A movement of 2.89% over 25 days on EURUSD doesn’t go unnoticed. You may start considering where it’s…
A Descending Triangle has formed, AUDUSD is approaching resistance. Can we expect a breakout and the start of a new trend or a reversal?
Emerging Descending Triangle pattern in its final wave was identified on the AUDUSD 4 hour chart. After a…