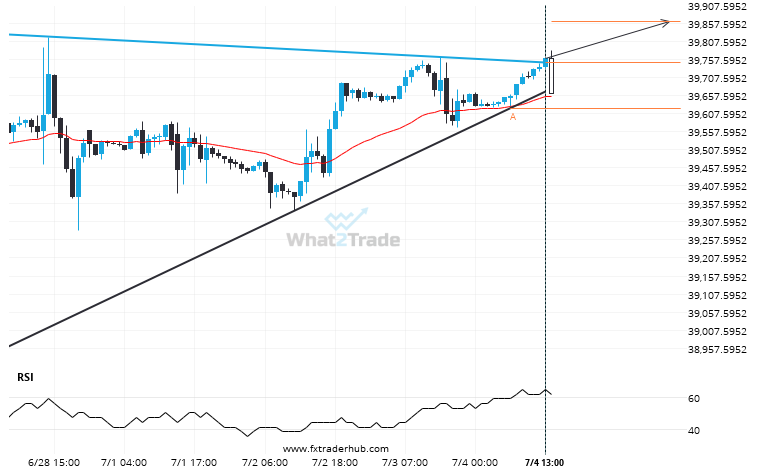
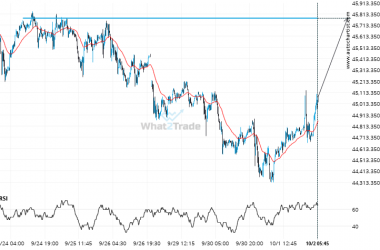
US30 moved through the resistance line of a Triangle at 39747.95522388059 on the 1 hour chart. This line has been tested a number of times in the past and this breakout could mean an upcoming change from the current trend. It may continue in its current direction toward 39862.5617.
Related Posts
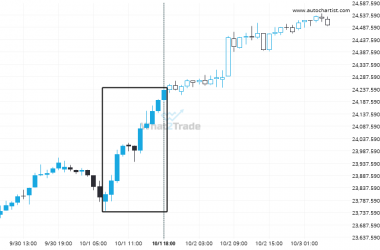
Big bullish swing on DAX 40 – this may be one of its more notable movements in the recent session.
DAX 40 reached 24232.6 after a 1.77% move spanning 11 hours.
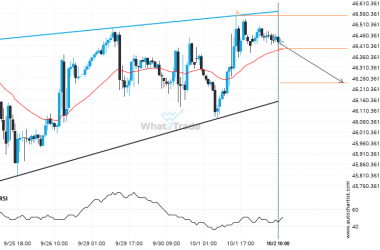
DOW 30 is signaling a possible trend reversal on the intraday charts with price not breaching resistance.
DOW 30 was identified at around 46395.84 having recently rebounded of the resistance on the 1 hour data…
Nikkei 225 heading towards a price it has tested 5 times in the recent past.
A strong resistance level has been identified at 45777.0000 on the 15 Minutes Nikkei 225 chart. Nikkei 225…

