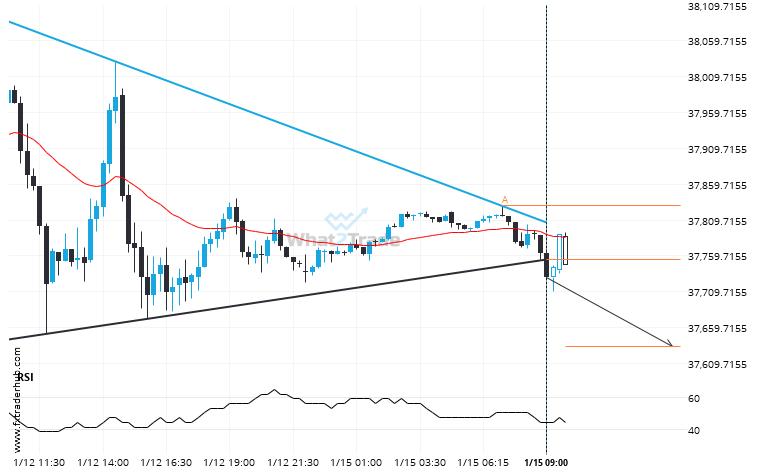
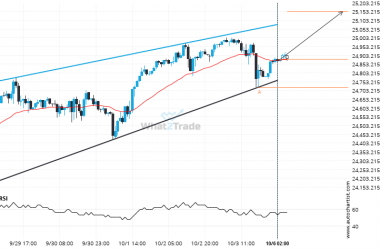
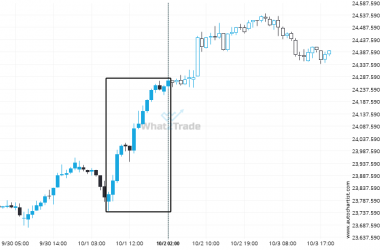
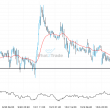
You would be well advised to confirm the breakout that has just occurred – do you believe the move through support to be significant? Do you have confirming indicators that the price momentum will continue? If so, look for a target of 37633.0337 but consider reducing the size of your position as the price gets closer to that target.
Related Posts
ASX 200 formed a Channel Up on the 1 hour chart. Retest of support in sight.
ASX 200 was identified at around 8577.7 having recently rebounded of the resistance on the 1 hour data…
CAC 40 has formed 7 bearish candles successively, what is the probability of getting another bearish candle?
Rare set of consecutive candles on the CAC 40 4 hour chart. Could we expect a turn around…
After trying numerous times in the past, US 500 finally breaks 6232.8999!
US 500 has broken through a line of 6232.8999. If this breakout holds true, we could see the…