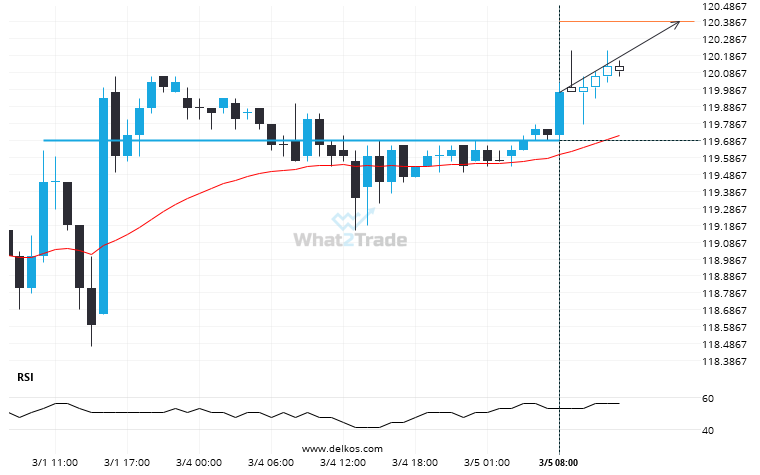
A strong resistance level has been breached at 119.6875 on the 1 hour Us Treasury Bond June 2024 chart. Technical Analysis theory forecasts a movement to 120.3906 in the next 6 hours.
Related Posts
Gold Spot through 3366.28135. Is this a confirming a breakout? Will it continue its path in the current trend toward 3306.1199?
Gold Spot has broken through a support line of a Rising Wedge and suggests a possible movement to…
A final push possible on Natural Gas as it starts approaching a price line of 3.3975.
Natural Gas is en route to a very important line that will be a definite deciding factor of…
Natural Gas through 3.425869565217391. Is this a confirming a breakout? Will it continue its path in the current trend toward 3.3833?
Natural Gas has broken through a support line of a Triangle chart pattern. If this breakout holds true,…