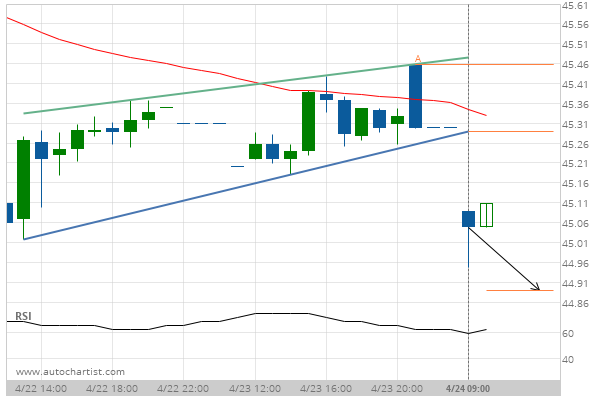
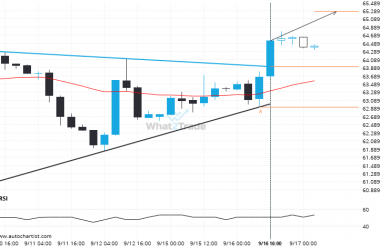
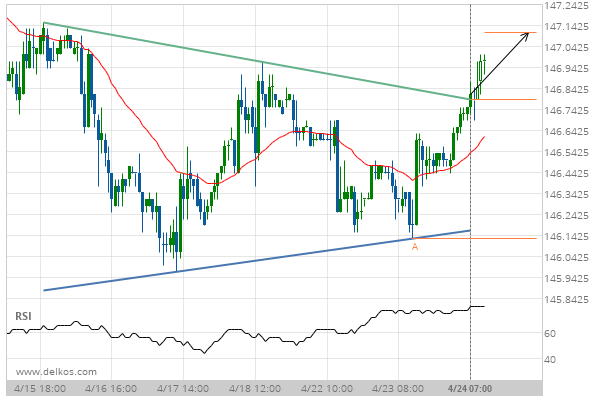
Triangle has broken through the resistance line at 24-Apr-2019 07:00 UTC. Possible bullish price movement forecast for the next 2 days towards 147.1049.
Related Posts
US Oil – approaching a support line that has been previously tested at least twice in the past
Emerging Channel Up pattern in its final wave was identified on the US Oil 4 hour chart. After…
Gold Spot is quickly approaching the resistance line of a Channel Up. We expect either a breakout through this line or a rebound.
Gold Spot was identified at around 3328.9805 having recently rebounded of the support on the 1 hour data…
Breach of 63.0270 could mean a start of a bullish trend on US Oil
A strong resistance level has been breached at 63.0270 on the 1 hour US Oil chart. Technical Analysis…