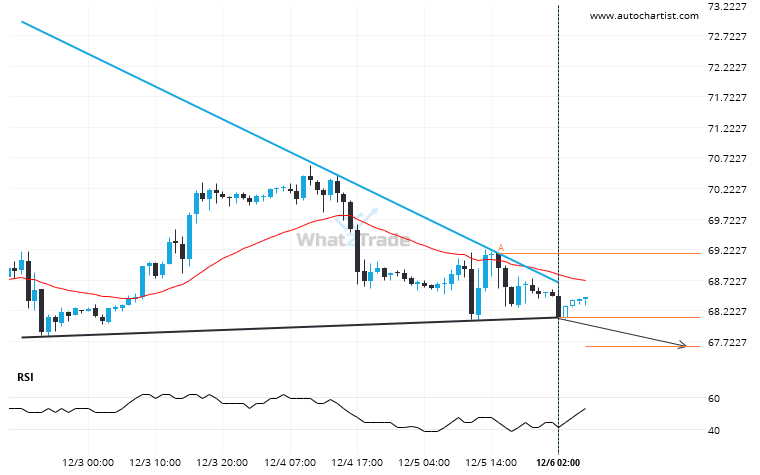
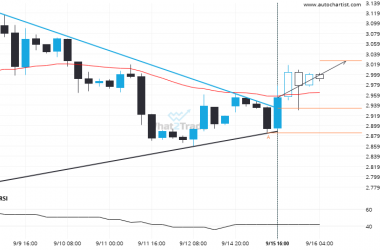
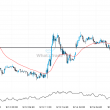
US Oil has broken through the support line of a Triangle technical chart pattern. Because we have seen it retrace from this line in the past, one should wait for confirmation of the breakout before taking any action. It has touched this line twice in the last 4 days and suggests a possible target level to be around 67.6346 within the next 20 hours.
Related Posts
Important price line breached by Natural Gas. This price has been tested numerous times before.
Natural Gas has breached the resistance line at 2.9680. It may continue the bullish trend towards 3.1010, or,…
Natural Gas through 2.9335. Is this a confirming a breakout? Will it continue its path in the current trend toward 3.0254?
Natural Gas has broken through the resistance line which it has tested twice in the past. We have…
Natural Gas is currently testing a level of 2.9285. Will the breakout continue or will things reverse?
Natural Gas has broken through a support line. Because we have seen it retrace from this price in…